The Macroeconomic System is composed of assets with changing daily valuations propelled higher or lower by an expanding or contracting GDP and ongoing debt obligations which represent both assets and liabilities. Money and debt creation are caused by the expansion of private, corporate, and government debt with central banks and private banks acting as the fortuitous intermediaries(and as a primary source with regard to the former element) accommodating ‘credit worthy’ loan applicants.
GDP grows as a result of money and debt creation. In recessions increased government borrowing (and central bank QE) acts as a counter-cyclical measure. Governments backed by nuclear-deliverable and capable military assets offer the greatest reassurance of loan repayment.
With an accommodating central bank and ongoing and future social contract promises to the 99% of private citizens, the US government will, per force, create more debt and money expansion than corporations(the billionaire class proxies) and the private sector combined.
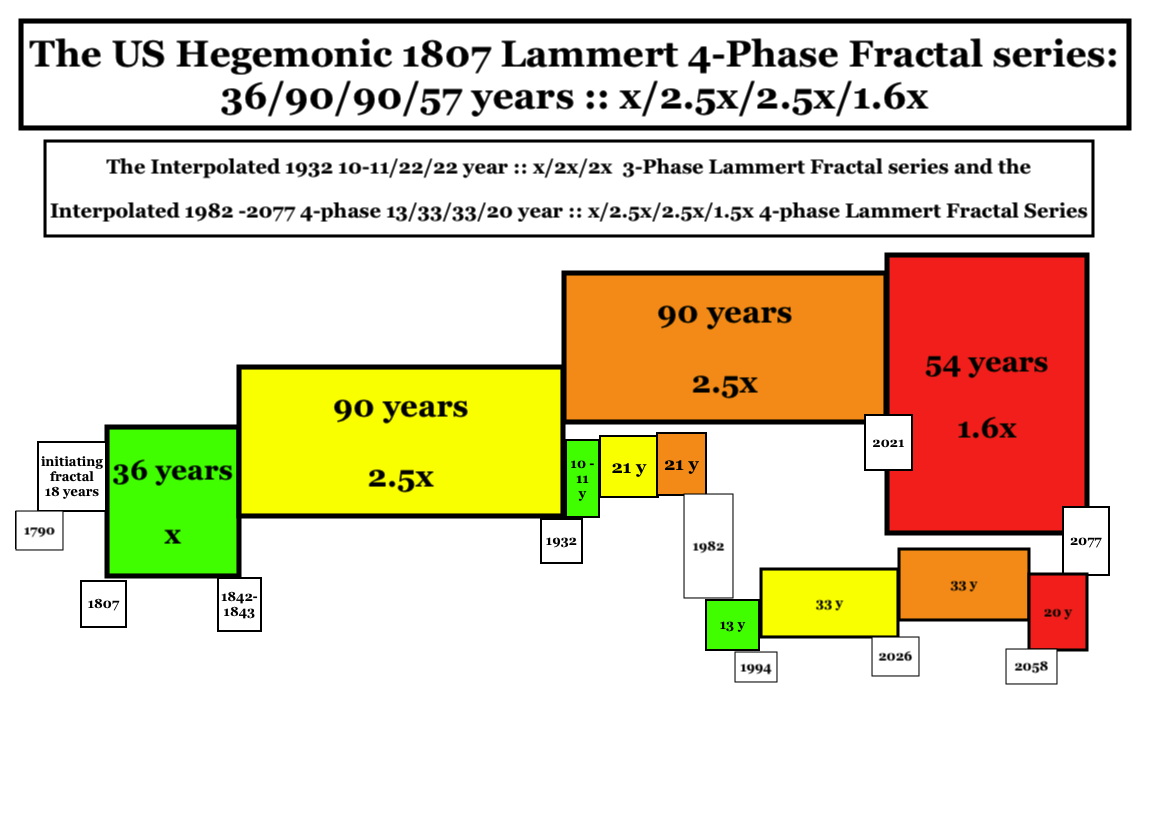
The end of prominent of major economic cycles and recessions occur for the pleurality of private citizens when the valuation of assets are too high, the personal debt load is collectively too great, the liabilities of held and sought after assets, e.g., property taxes, new home and car loans, and the cost ongoing assets of daily living exceed the ability to pay or to further expand private debt. After lofty overvaluation of asset prices, these devaluations occur periodically and in a nonlinear fractal manner. The major self-ordering US fractal cycle is an 1807 36/90/90/54-57 year :: x/2.5x/2.5x/1.5-1.6x cycle with nadir commodity/equity prices in 1807, 1842-32, 1932, and expected in 2074-2077 with a 90 year 3rd fractal peak in November 2020 extended to higher highs by 7-15% annual US deficit to GDP spending in 2020 -2025.
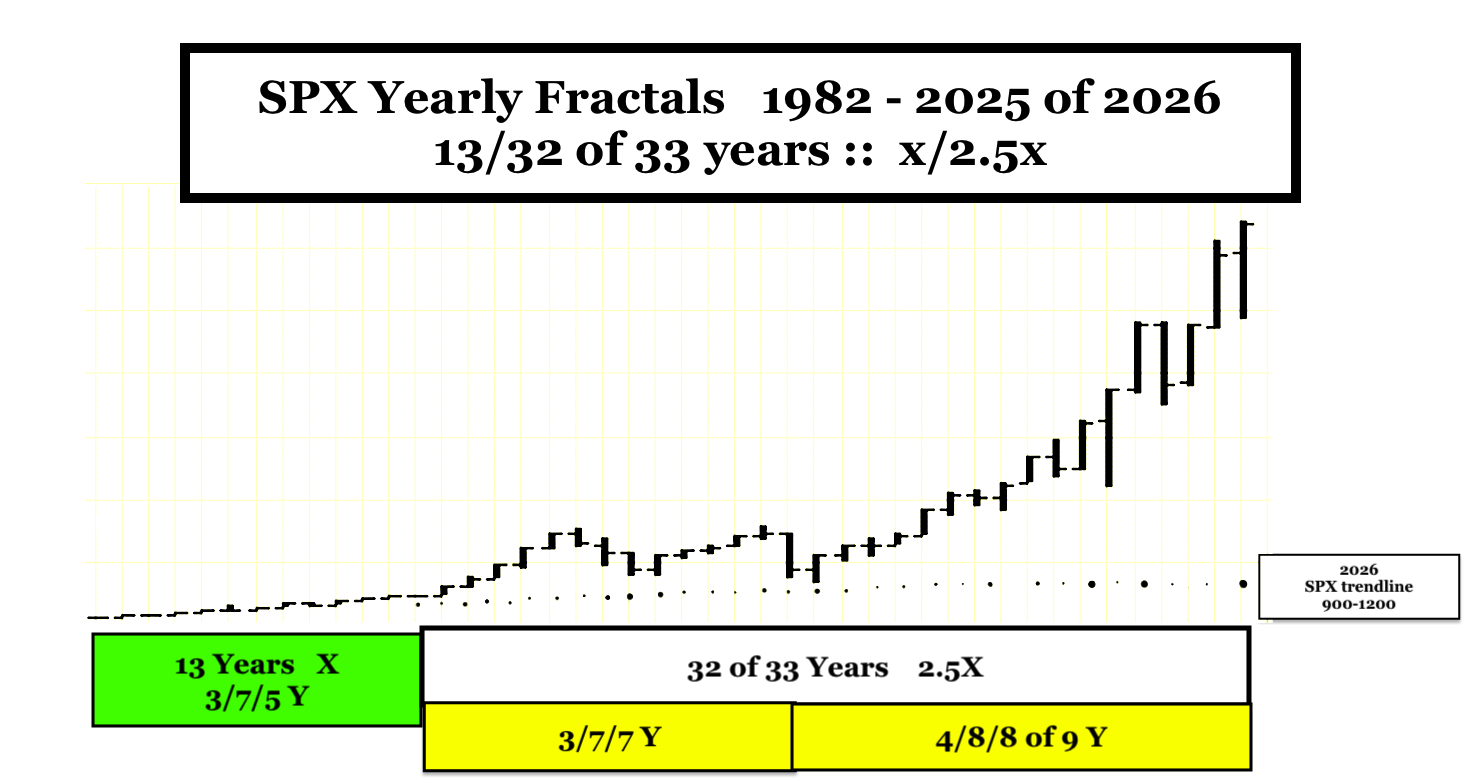
After a 1932 10-11/21-22/21-22 :: x/2x/2x fractal growth cycle ending in 1982, the dominant interpolated fractal cycle from 1982 is 13/32 of 33/33/20 years ending in 2077.
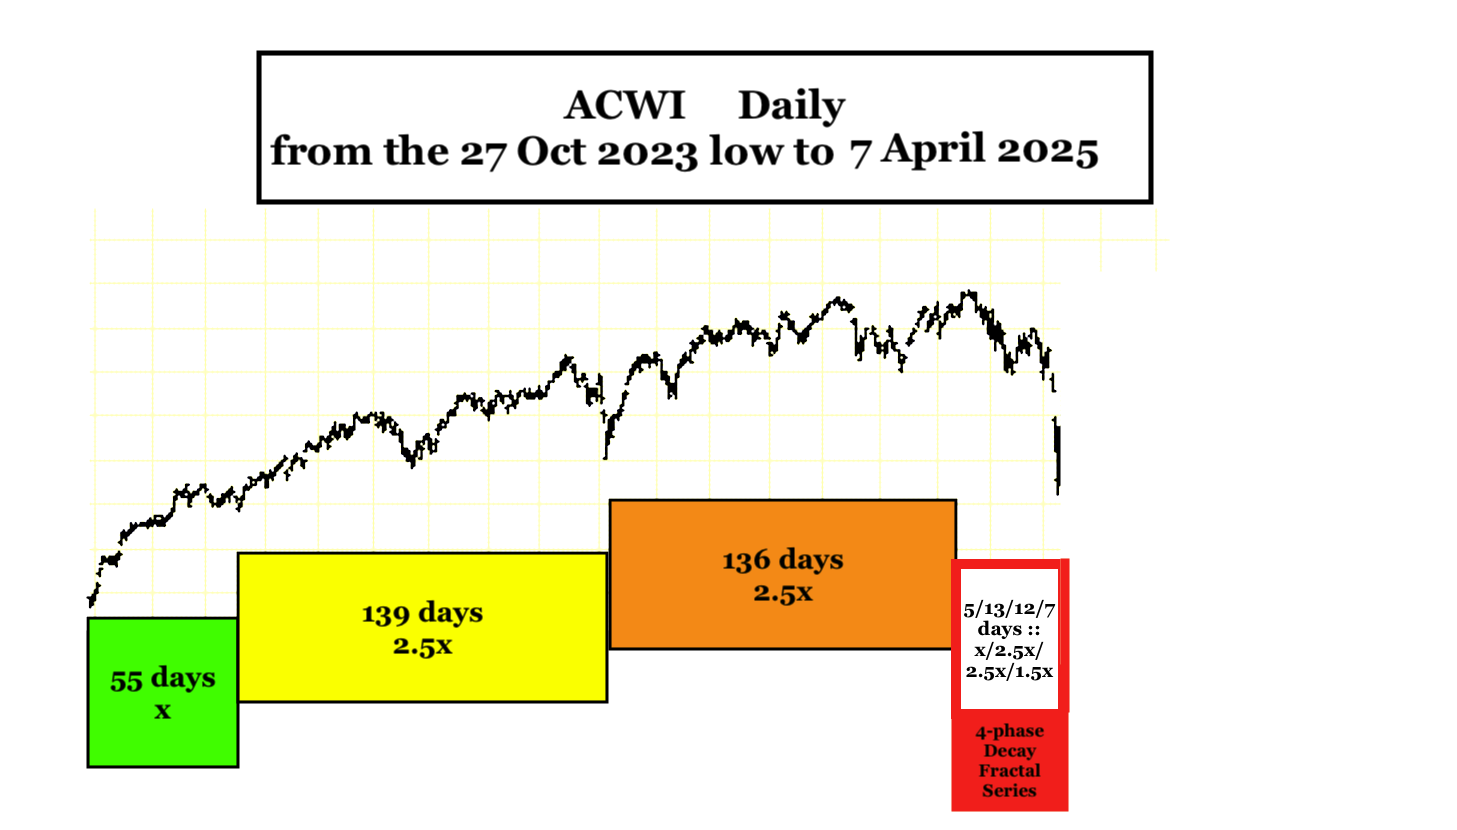
A March 2020 9/23/14 month :: x/2.5x/1.5x fractal cycle was followed by a 27 Oct 2023 119/ 243 day cycle ending 7 April 2025. Nonlinearity in the 2nd 243 day 2nd fractal is seen between days 240 and 241 and days 241 and 242 with a final low on day 243 7 April 2025.
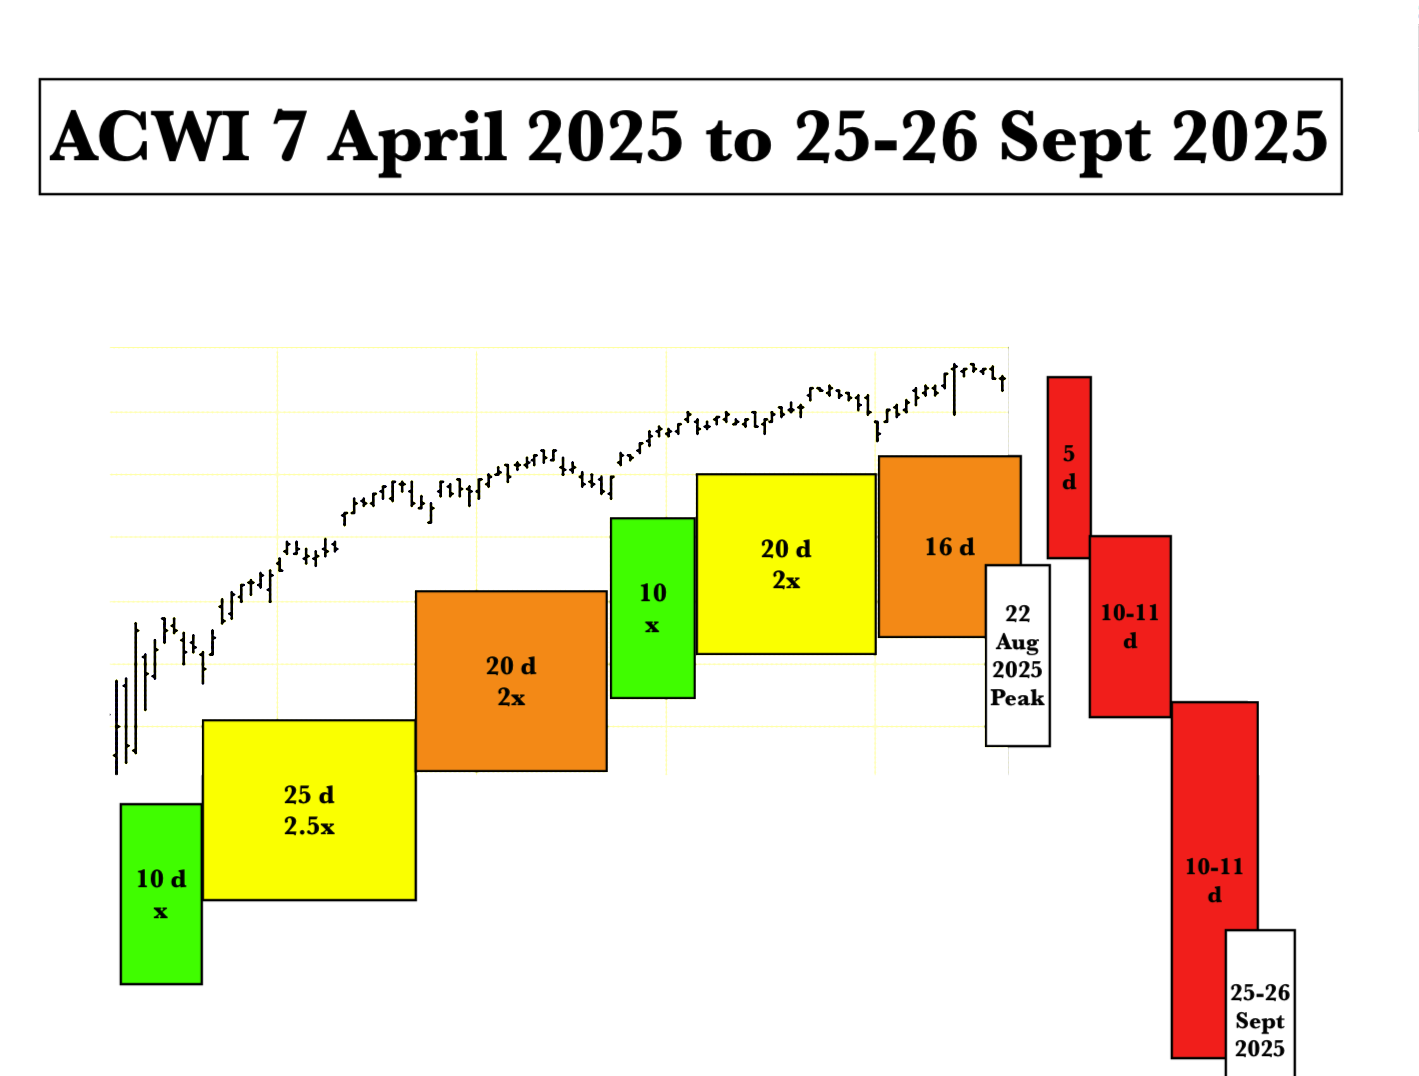
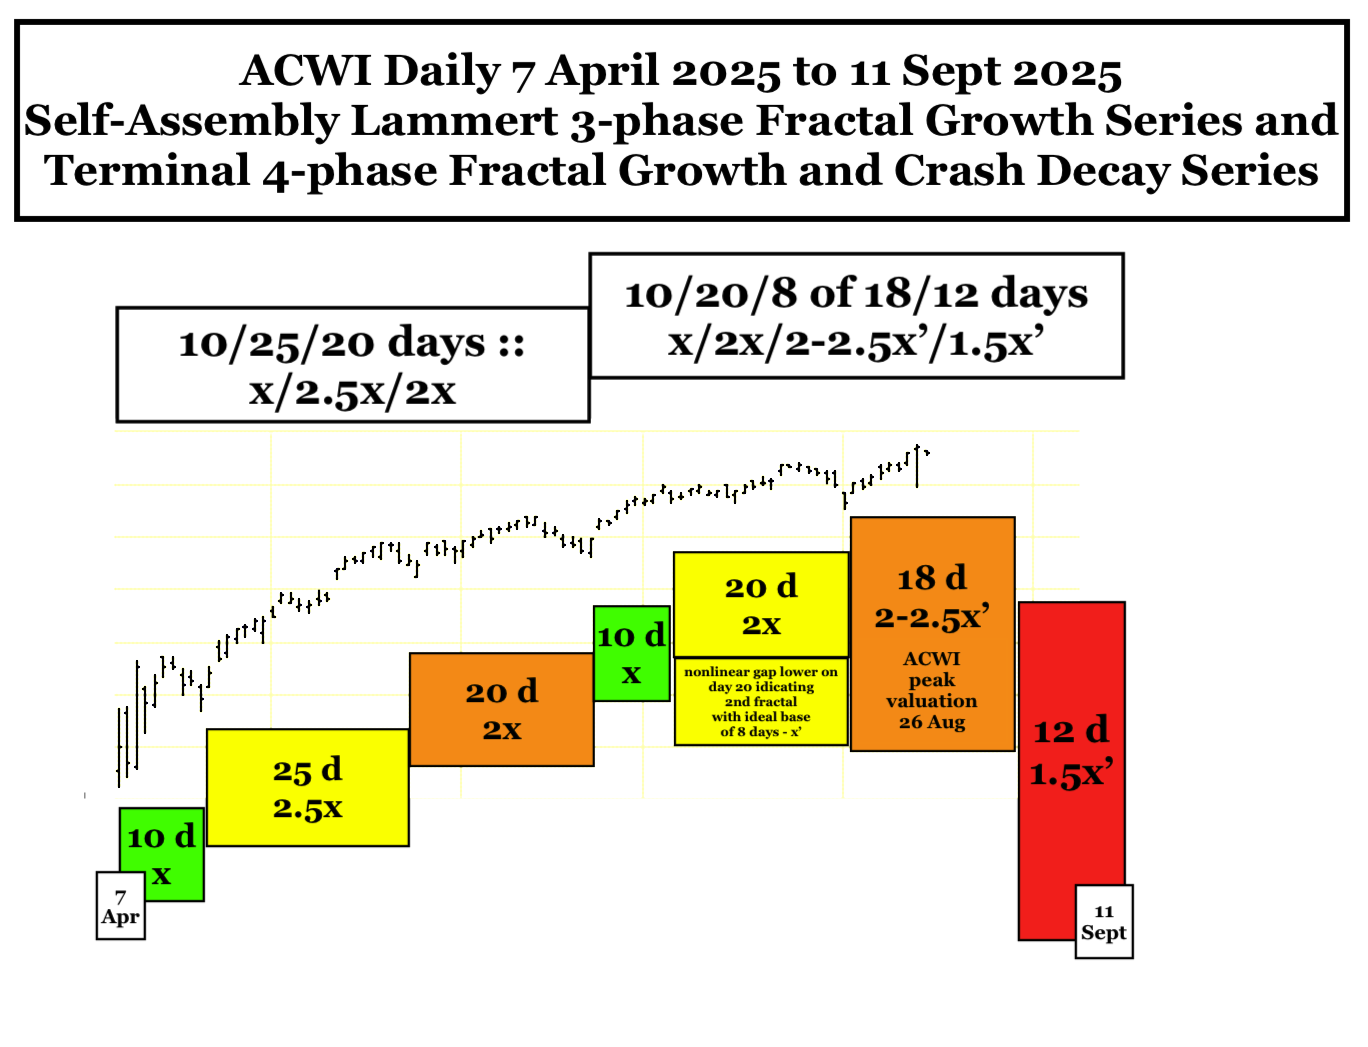
From the 7 April 2025 nadir an ACWI 105 day 53/53 day peak is expected to occur on 5 September 2025 composed of two sequential fractal growth series of 10/25/20 days and 10/20/25 days. A 5 Spet 2025 15-22 day crash series of 5/11/7 days will take the ACWI to a 11 day 2nd fractal low on 25 September 2020 with a lower low or higher low on day 7/8 of the 3rd fractal on 3-6 October 2025.
With the market (and the fed following) creating lower interest rates, a 119 day rebound is expected with a final crash of 15-21/22 days with a low in March/April of 2026.