Is there an underlying time-based self-assembly fractal order to the growth and decay of equity valuations in the asset-debt macroeconomic system?
It is the hypothesis of this website that the asset-debt system self-orders equity valuation growth and decay by two simple time-unit based fractal equations : a 4-phase fractal series: x/2-2.5x/2-2.5x/1.5-1.6x with respective units termed the 1st, 2nd, 3rd and 4th Fractal, and a 3-phase fractal series: x/2-2.5x/1.5-2.5x with respective units termed 1st, 2nd, and 3rd Fractals. In the 4-phase fractal series, the 3rd 2-2.5x fractal represents peak valuation growth, all other end points in the 4-phase series and all end points the 3 phase fractal series represent nadir valuations. Fractal groupings are defined by underlying trendlines from the beginning to the end of the grouping. 2nd Fractals of both 3 and 4 phase fractals are characterized by a nonlinear lower low gap valuation in the terminal 2x to 2.5x portion of the 2nd fractal. The inception of fractal valuation decay is conjoined and interpolated with end fractal peak growth and vice versa.
After the Buttonwood agreement in 1792 and an initiating 4 phase fractal series of 16years, an 1807 4-phase US hegemonic fractal series of 36/90/90/54-57 years commenced with lows in 1842-43, 1932, a 90 year high in 2021, and an expected low in 2074-77.
The 90 year 3rd and the 54-57 year 4th Fractals of this series starting in 1932, are composed of two fractal series: a 3-phase 10-11/20-21/20-21 :: x/2x/2x series ending in 1982 and a 1982 13/currently 32 of 33/33/20 year series ending in 2076.
The 90 year 3rd fractal peaking Nov 2021 is interpolated in the 1982 13/33 :: x/2.5x first and second fractal series as shown below.
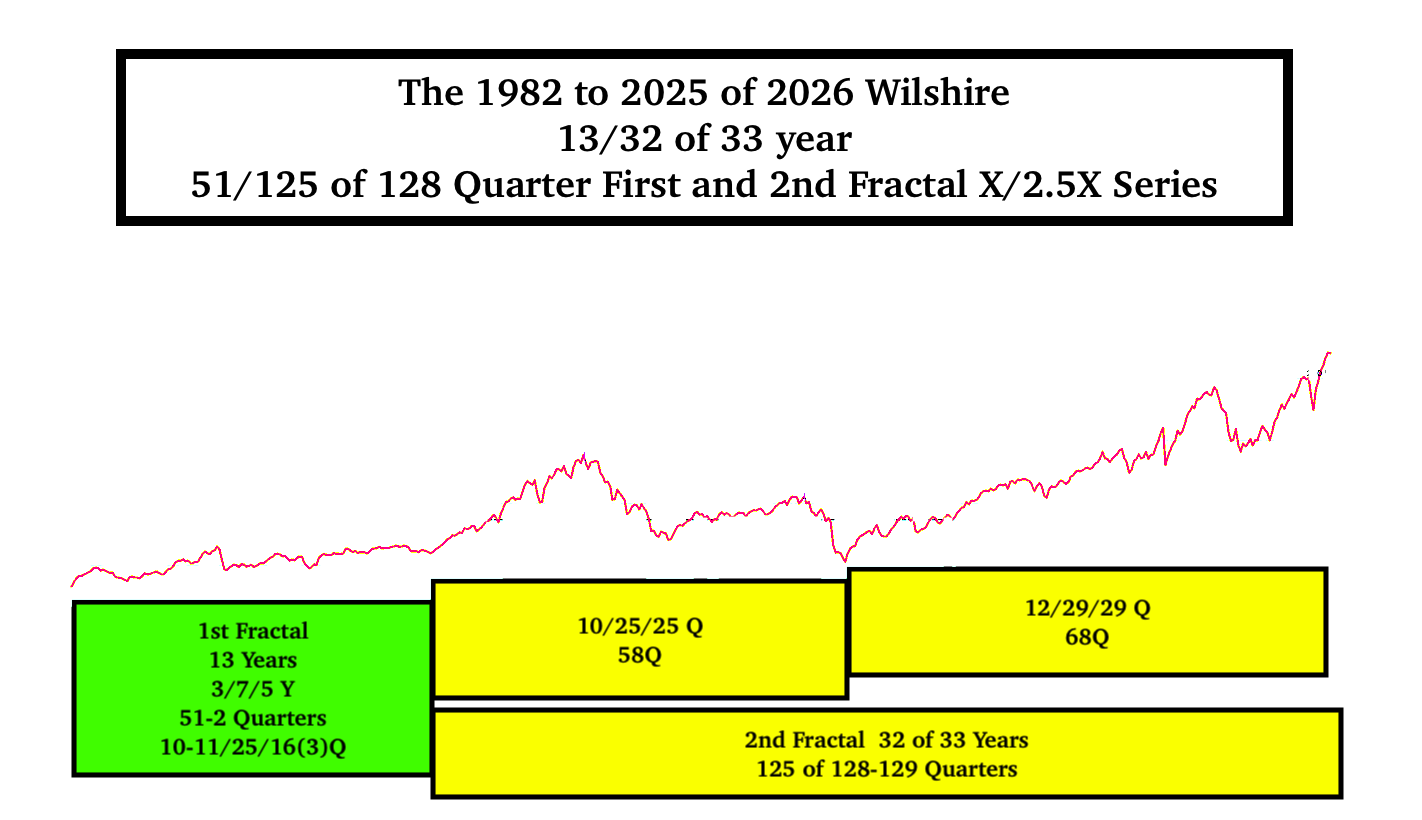
The 90 year 2.5x Nov 2021 valuation peak was later exceeded because of average annual US deficit to GDP governmental spending from 2020-2025 of 8.4%. This deficit to GDP spending compares to the long average from 1948 to 2020 of 2.6%. The 2020-2025 deficit spending generated an average GDP growth of 2.9% vice a long term 3.15% which includes a negative 7% in 2009 of the great recession. Covid 2020 and 2021 15% and 12% deficit to GDP spending , supply chain disruptions, build back better spending , and the recent tax breaks for billionaires have contributed to the peacetime massive deficit spending.
US Equity (and the global equity composite) valuations peaked on 28/29 Oct 2025 at over 220% of US GDP – an all time historical high. What causes the timing of peak equity valuation? Equities are the most taxed advantaged asset within the asset debt system and their valuations grow to the longest possible fractal growth. Accompanying this tax advantage, fractal length to peak is ultimately determined by ongoing credit expansion produced by a residual sufficient population of governmental, corporate, and consumers, willing and able to go into further debt – given the cost of ongoing ADL’s (activities of daily living including insurance premiums), job and wage expectations, payments on accumulated debt, perceived business opportunities, and concurrent asset valuation prices and expectations of asset future valuations. The October 2025 peak valuation ended the 12/29/29 Quarterly :: x/2.5x/2.5x maximum growth of the 3-phase fractal series starting March 2009. (This was preceded by a 10/25/25 Quarter :: x/2.5x/2.5x 3 phase series starting 1994. (see above graph)
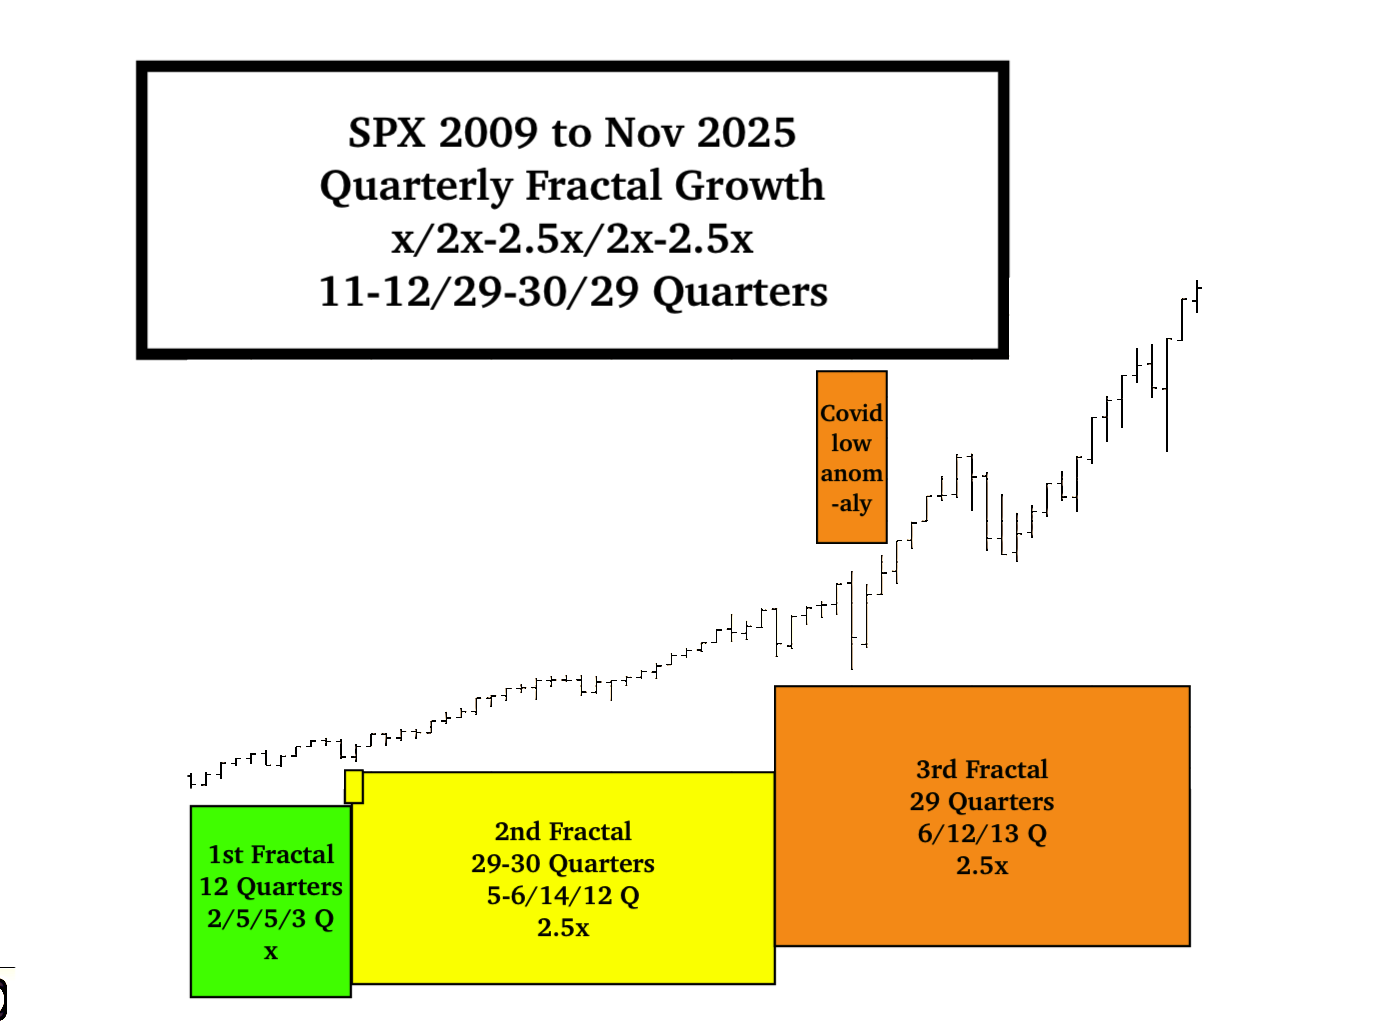
The 3rd 29 Quarter Fractal of the SPX ‘s current 2009 12/29/29 quarter :: x/2.5x/2.5x 3-phase fractal growth series -started with a nadir in December 2018 and is composed of a 6/12/13 quarter :: 16/32/37 month :: x/2x/2.5 fractal subseries (as of Nov 2025). The Global Covid shock anomaly with unemployment spiking from 3.9% in late 2019 to 14.7% in April 2020 produced an anomaly in fractal equity valuation with Q6 of the 1st Fractal 6Q subseries having a lower valuation nadir than Q1. A lower valuation fits with the associated credit contraction, offset in April 2020 with stimulus checks and later MBS credit expansion.
The final 13Q 3rd Fractal of the 2018 6/12/13 Q 3-phase series is composed of a 2/4/5/3 or 11 Q 4-phase series and 3 quarter fragment starting 7 April 2025. It is composed of a 53 /111 day :: x/2- 2.5x First and 2nd Fractal series .
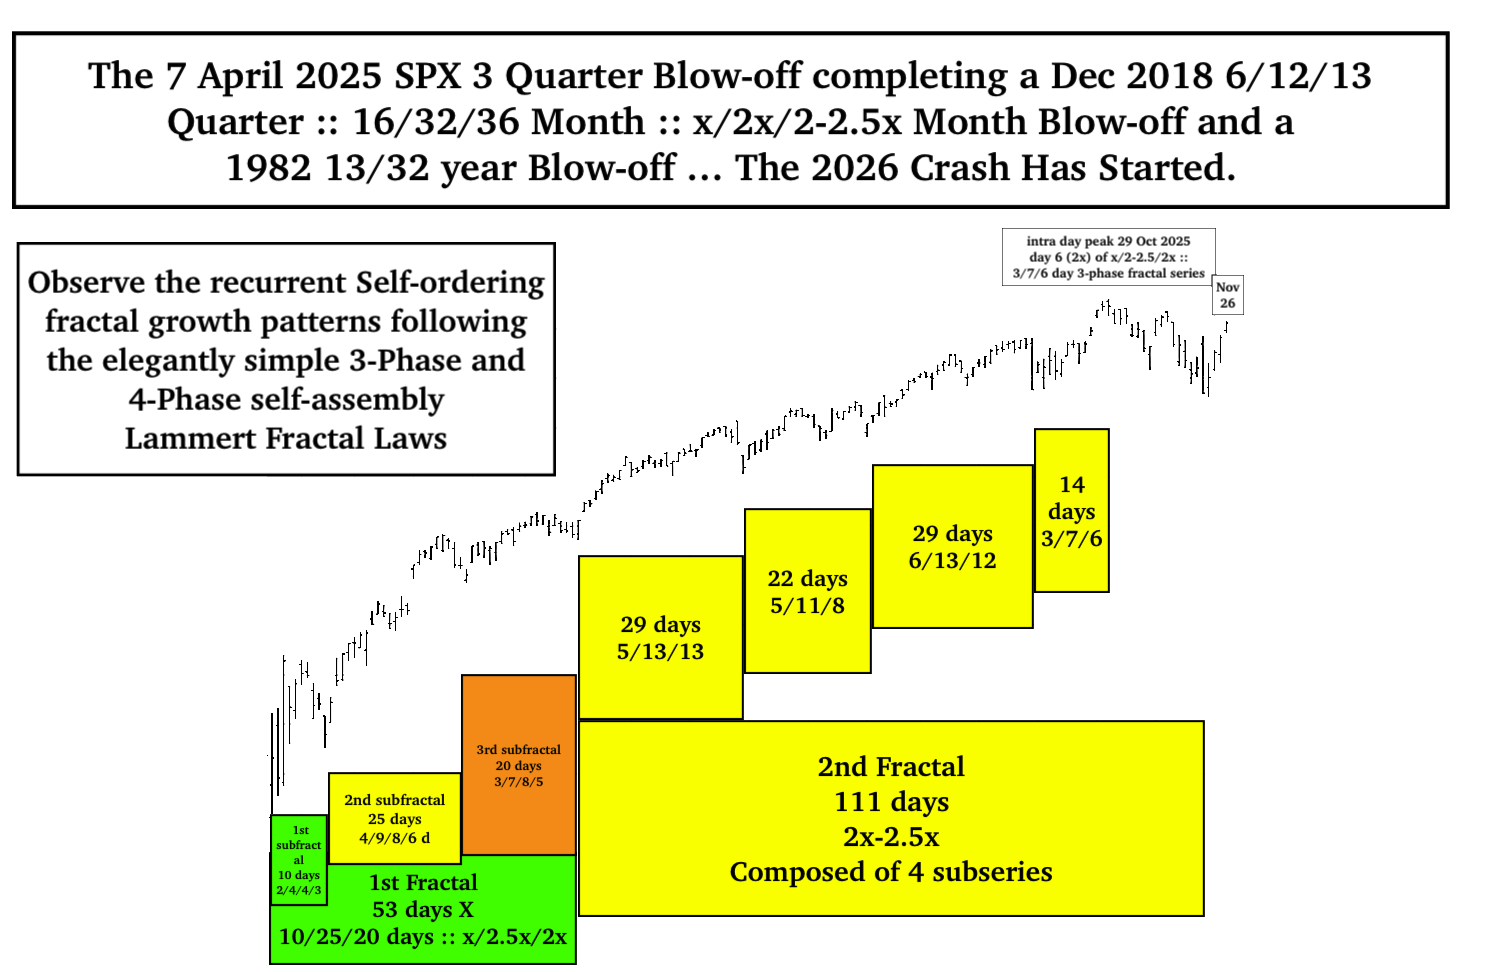
Fractal subseries self-ordering growth of the 53/111 day fractal series has exquisitely followed the above cited 3-phase and 4-phase fractal growth self-assembly laws.
1929 and 2025 Initial Crash Decay
1932 concluded an 1807 36/90 year :: x/2.5x first and second fractal series; 2026 will conclude a. 1982 13/33 year :: x/2.5x first and second fractal series. In 1932 the peak to nadir devaluation of 90% occurred over 32 months with a definable pattern of fractal decay, fractal counter rally growth and further fractal decay.
In 1929 peak growth on 3 Sept 1929 occurred in the 8 day 3rd fractal of a 5/11/8 day :: x/2-2.5x/1.6x 3 phase fractal series. The 8 day 3rd fractal containing peak growth became the interpolated incipient 1st fractal of a 8/19/16/12 day :: x/2.5x/2x/1.5x day 4-phase series taking the DJIA to its initial Nov low with a loss of 50% of its value.
The final Oct 2025 growth fractal series for the SPX is a 10 Oct 3/7/6/5 day series :: x/2-2.5x/2x/1.6x ending 4 Nov 2025. A prior 27 October 7/17-18/14/10 day incipient crash fractal series was postulated. Friday is day 18 of this possible fractal solution. Another possibility is a 22 Oct 2025 9-10/17 of 18-20/16-18/12-13 day 4 phase x/2x/2x’/1.5x’ fractal crash decay series where x’ = 8 days.
The SPX 10 Oct 2025 3/7/6 day :: x/2-2.5x/2x blow-off series to the 29 Oct intraday peak and the completed 3/7/6/5 day :: x/2-2.5x/2x/1.6x 4-phase fractal series has an equivalent 15-16/39-40/38/24 hour :: x/2-25x/2-2.5x/1.5x 4 phase series.
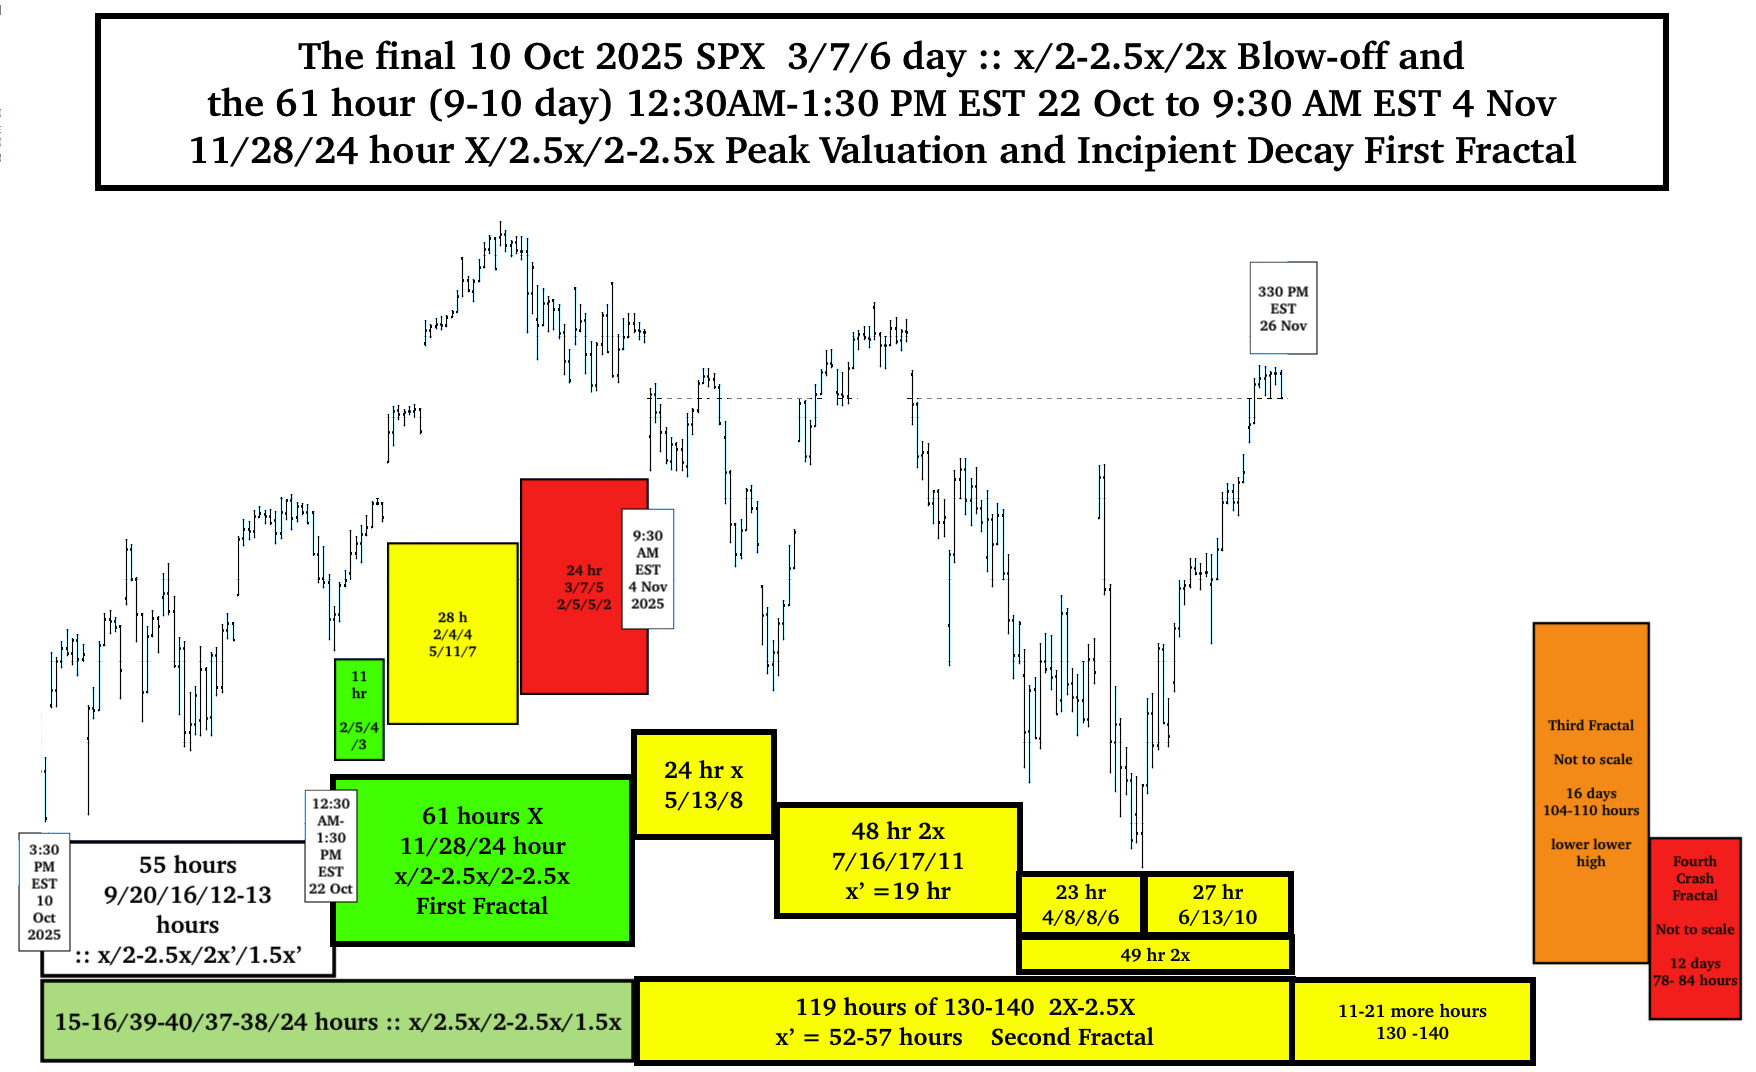
This can be further subdivided into two fractal series, 1. a 4 phase 9/20/16/12-13 hour :: x/2-2.5x/2x’/1.5-1.6 x’ series where x’ = 8 hours, the 2nd fractal length divided by 2.5, and 2. a 11/28/24 hour :: x/2.5x/2-2.5x series starting 1230AM to 130PM on Oct 22 and ending 930 AM 4 Nov. The 61 hour base fractal starts mid day on 22 Oct and ends the first hour of 4 Nov, with closer length of 9 days rather 10 days. From 930 EST 4 November 2025, the hourly projected 4 phase crash fractal is 61/ 119 of 130-140/104-110/78-84 hours, ending the last day in Dec to the first week in January 2026.