While there will be counter valuation growth cycle after the 27 March 2026 ACWI Global Equity Valuation Peak, the 1982-2026 13/33 year :: x/2.5x 1st and 2nd fractal global equity crash will occur over a relatively short time frame.
A Primer on Quantitative Time-based Self-Assembly Lammert Fractal Growth and Decay of Valuations of The Asset-Debt Macroeconomic System’s Composite Equities
Qualitatively …on the longest time-unit cycles (years) (e.g. 1807 36/90/90/54-57 years :: x/2.5x/2.5x/1.5-1.6x and 1982 13/32 of 33/32-33/20 years x/2.5x/2.5x/1.5-1.6x) credit expands via governmental, corporate, and citizen debt; assets are produced and over-produced , overvalued and over-consumed; consumers reach maximum debt loads; the population of possible traders/invested are fully invested and composite equity asset valuations reach a singular fractal time-unit (minute, hour, day, week, month) peak valuation and thereafter undergo decay; recessions occur with weakening demand, interest rates fall; excess debt undergoes default and restructuring; individual and corporate bankruptcies occur; and composite equity (and commodity) asset valuations eventually reach a singular fractal time-unit nadir. The cycle thereafter repeats itself.
On smaller time-unit fractal cycles (quarters, months, weeks, days, hours, 15-minute/ 5 and 1-minute) : trader/investor population saturation of asset buying occurs ending in a transient peak valuation .. followed by trader/investor population saturation end selling resulting in a transient nadir valuation. These peaks and nadirs occur in one of the two quantitative fractal patterns as above.
Empirically composite equity asset valuation growth and decay cycles occur in 2 modes(laws) of mathematical deterministic self-organizing, self-assembly time-based fractal series:
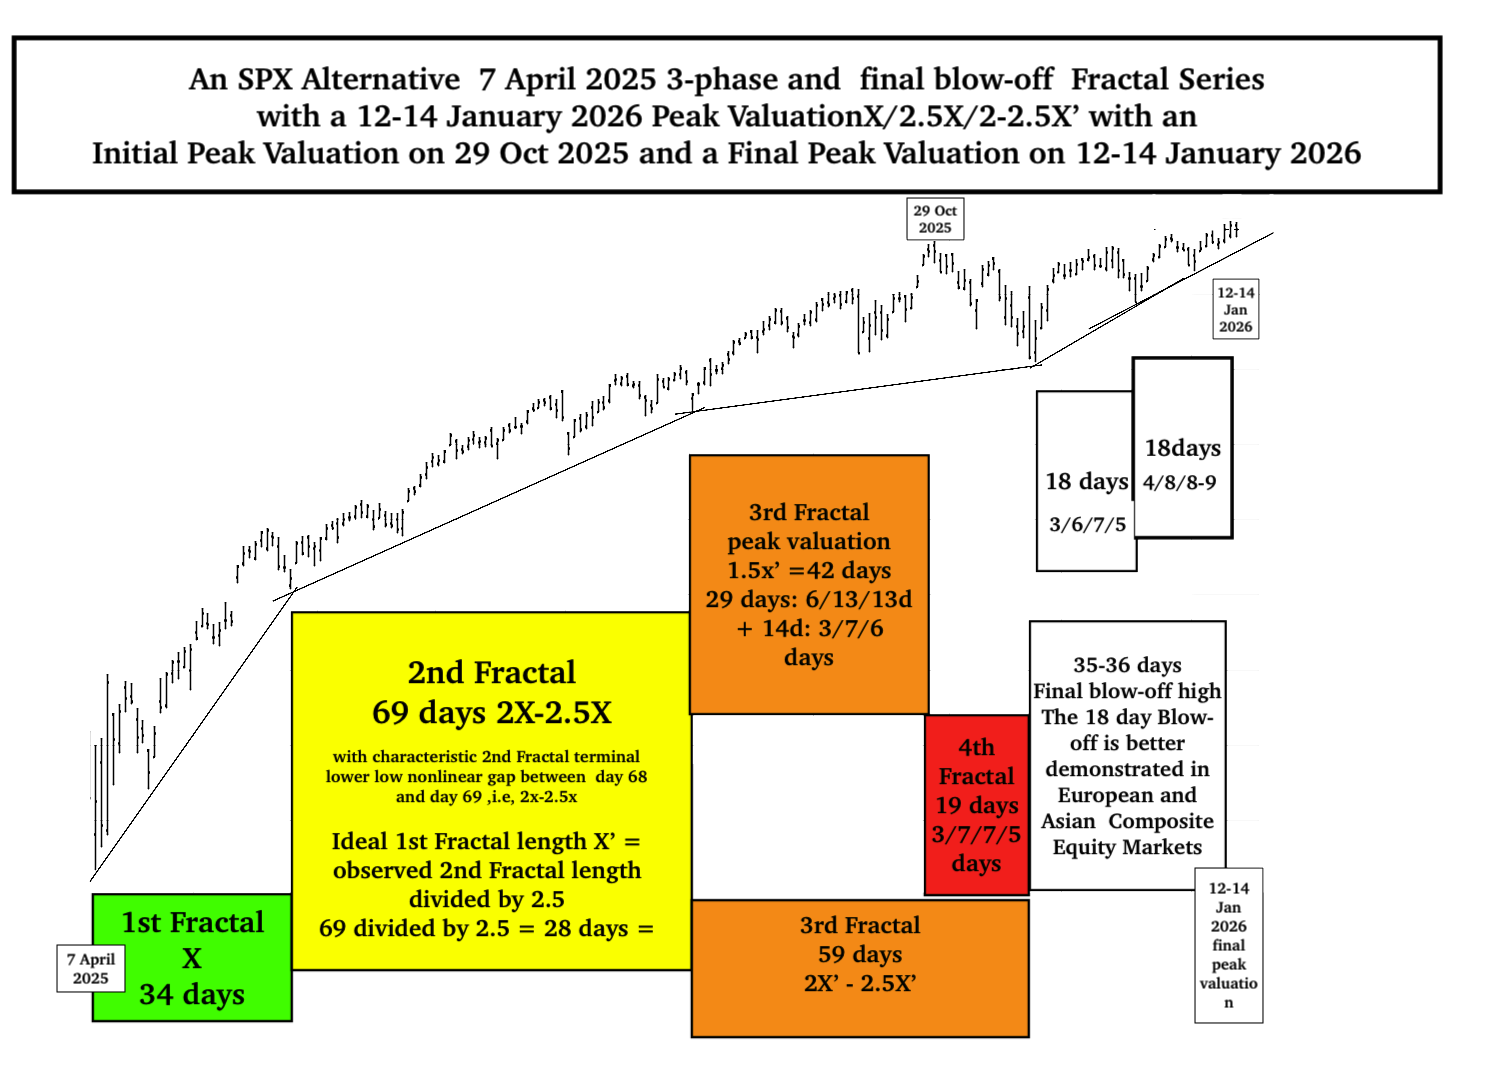
a 4-phase fractal series: x/2-2.5x/2-2.5x/1.5-1.6x and
a 3-phase fractal series: x/2-2.5x/1.5-2.5x
In the 4-phase fractal series sequential elements are termed: the 1st, 2nd, 3rd, and 4th fractals and in the 3-phase fractal series: the 1st, 2nd, and 3rd fractals.
The 2nd fractal is characterized by terminal gapped nonlinear lower lows between the 2nd fractal’s terminal 2x and 2.5x time period. (These gapped nonlinear lower lows can be observed in weekly valuation units for the DJIA between 1929 and 1932, the terminal portion of the US 90 year 2nd fractal; within the last three day before the terminal 5 August 2024 139 day 2nd fractal low occurring in an interpolated ACWI/SPX 27 October 2023 55/139/135-136 day (SPX-ACWI respectively) :: x/2.5x/2.5x valuation maximum growth series ending 18/19 February 2025: and can be expected within the last months on a daily and weekly basis of the current 32 of 33 year 2nd fractal of the interpolated 1982 13/32 of 33 year 1st and 2nd fractal series. (The 27 October 2023 dominant fractal series appears to have a 119 first fractal base, whereas the 55/139/136 day 3 phase growth series was a secondary interpolated series).
With the exception of the 3rd fractal in the 4-phase series whose fractal grouping is determined by its terminal high or final lower high peak valuation, fractals (fractal groupings) are determined by the nadirs of the first and last time unit in the grouping with all intervening valuations above the connecting nadir trend-line.
Current 1982 -2026 Self-Assembly Fractal Model:
1982 -2026 Terminal Fractal Growth
1982 to 2026: 52/126 of 130 Quarters :: x/2-2.5x
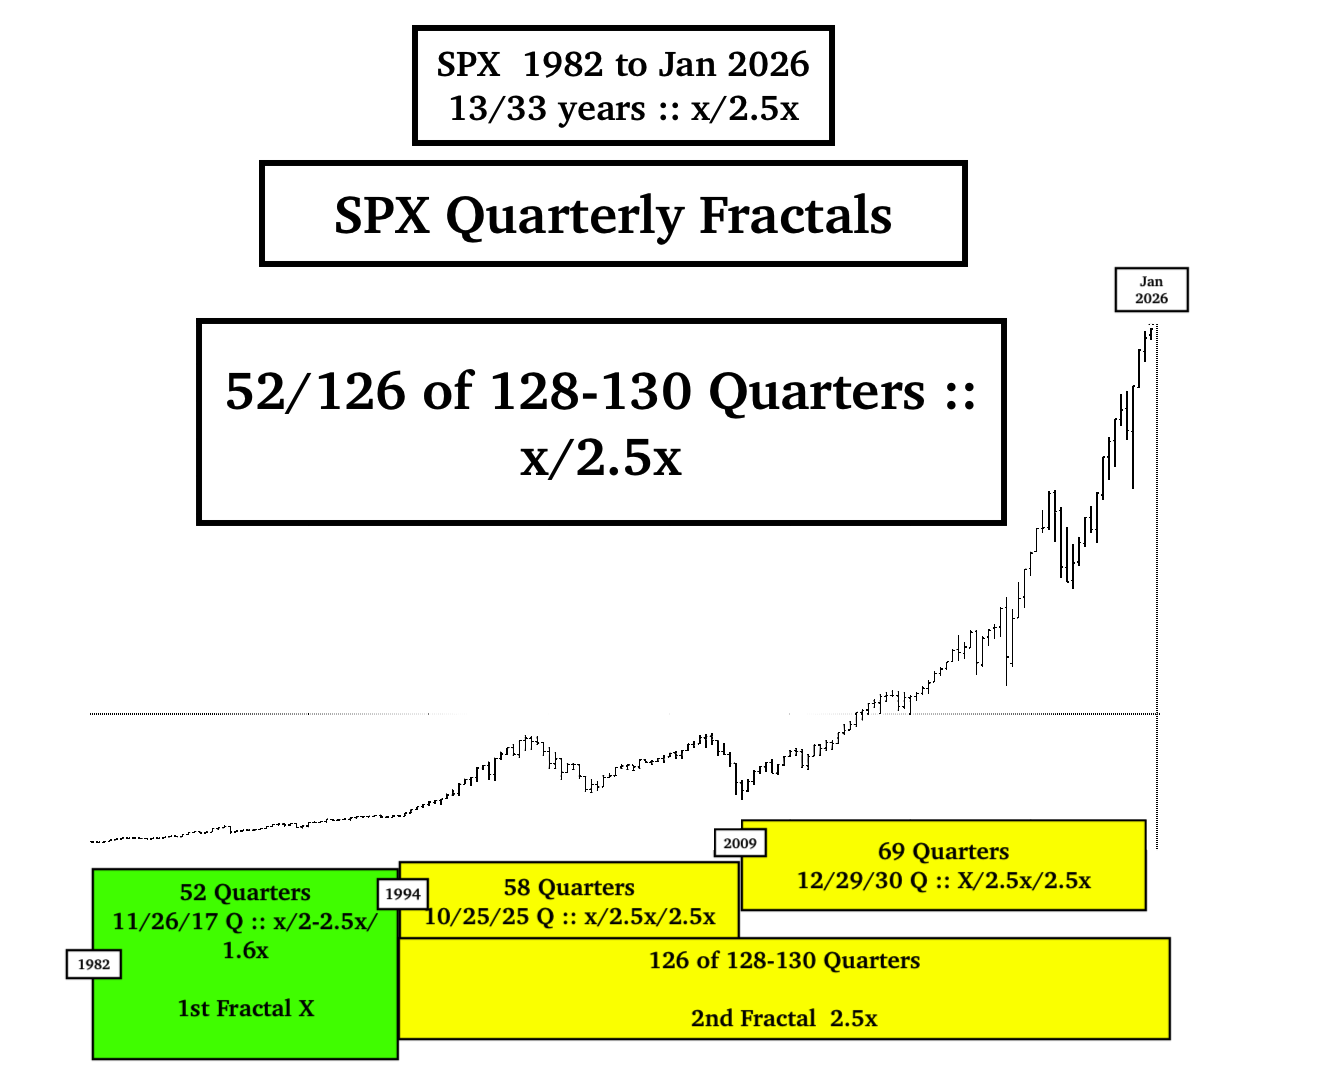
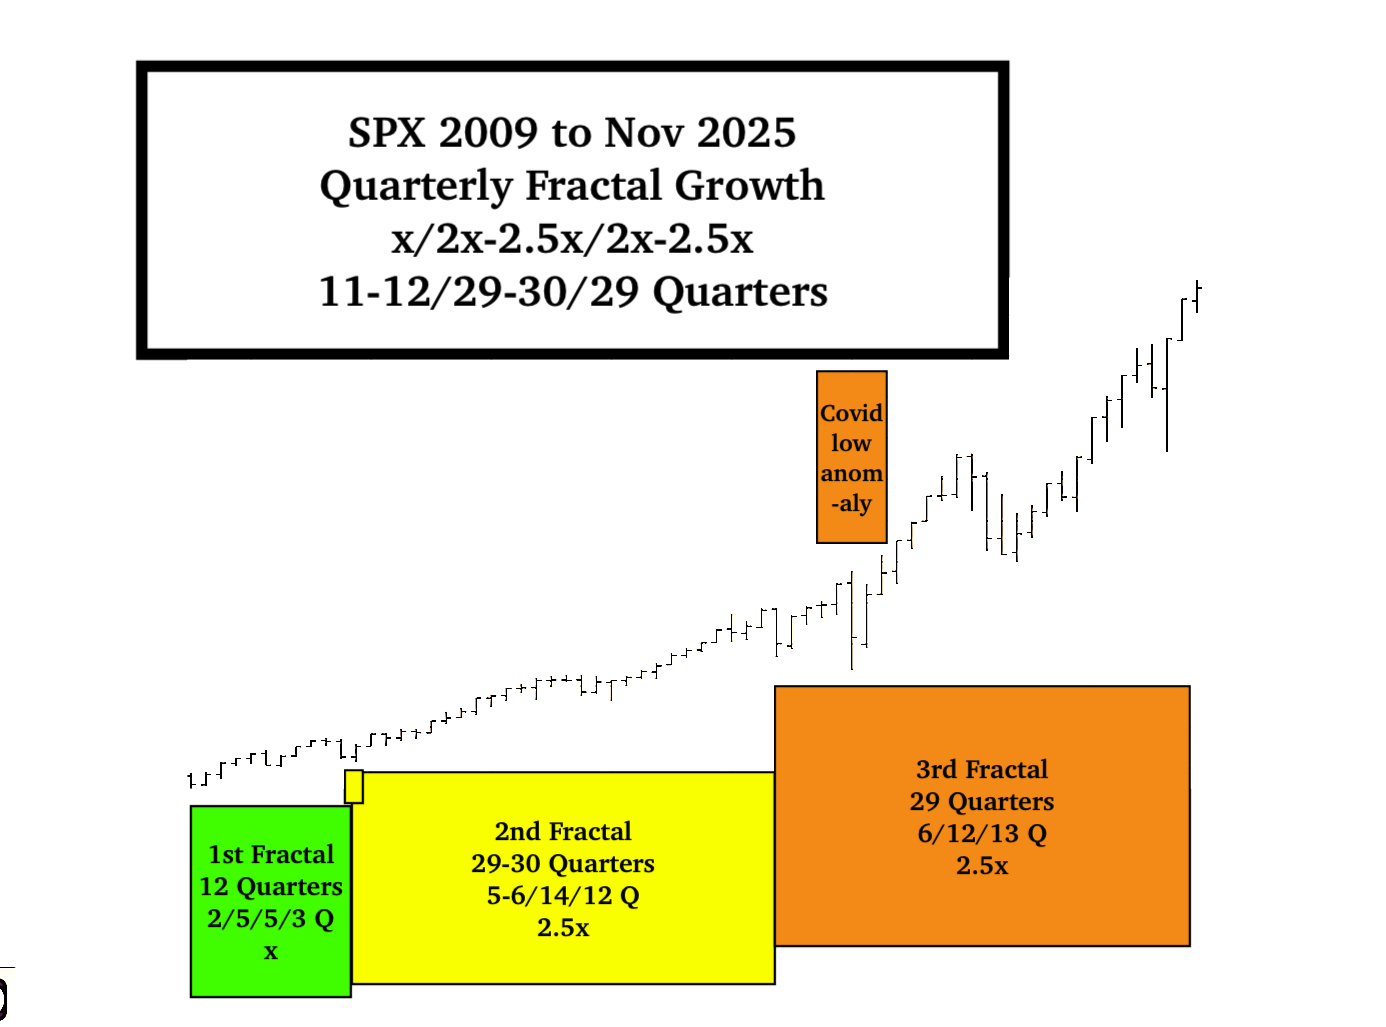
2009-2026 Terminal Fractal Growth:
11-12/29-30/30 Quarters :: x/2.5x/2.5x
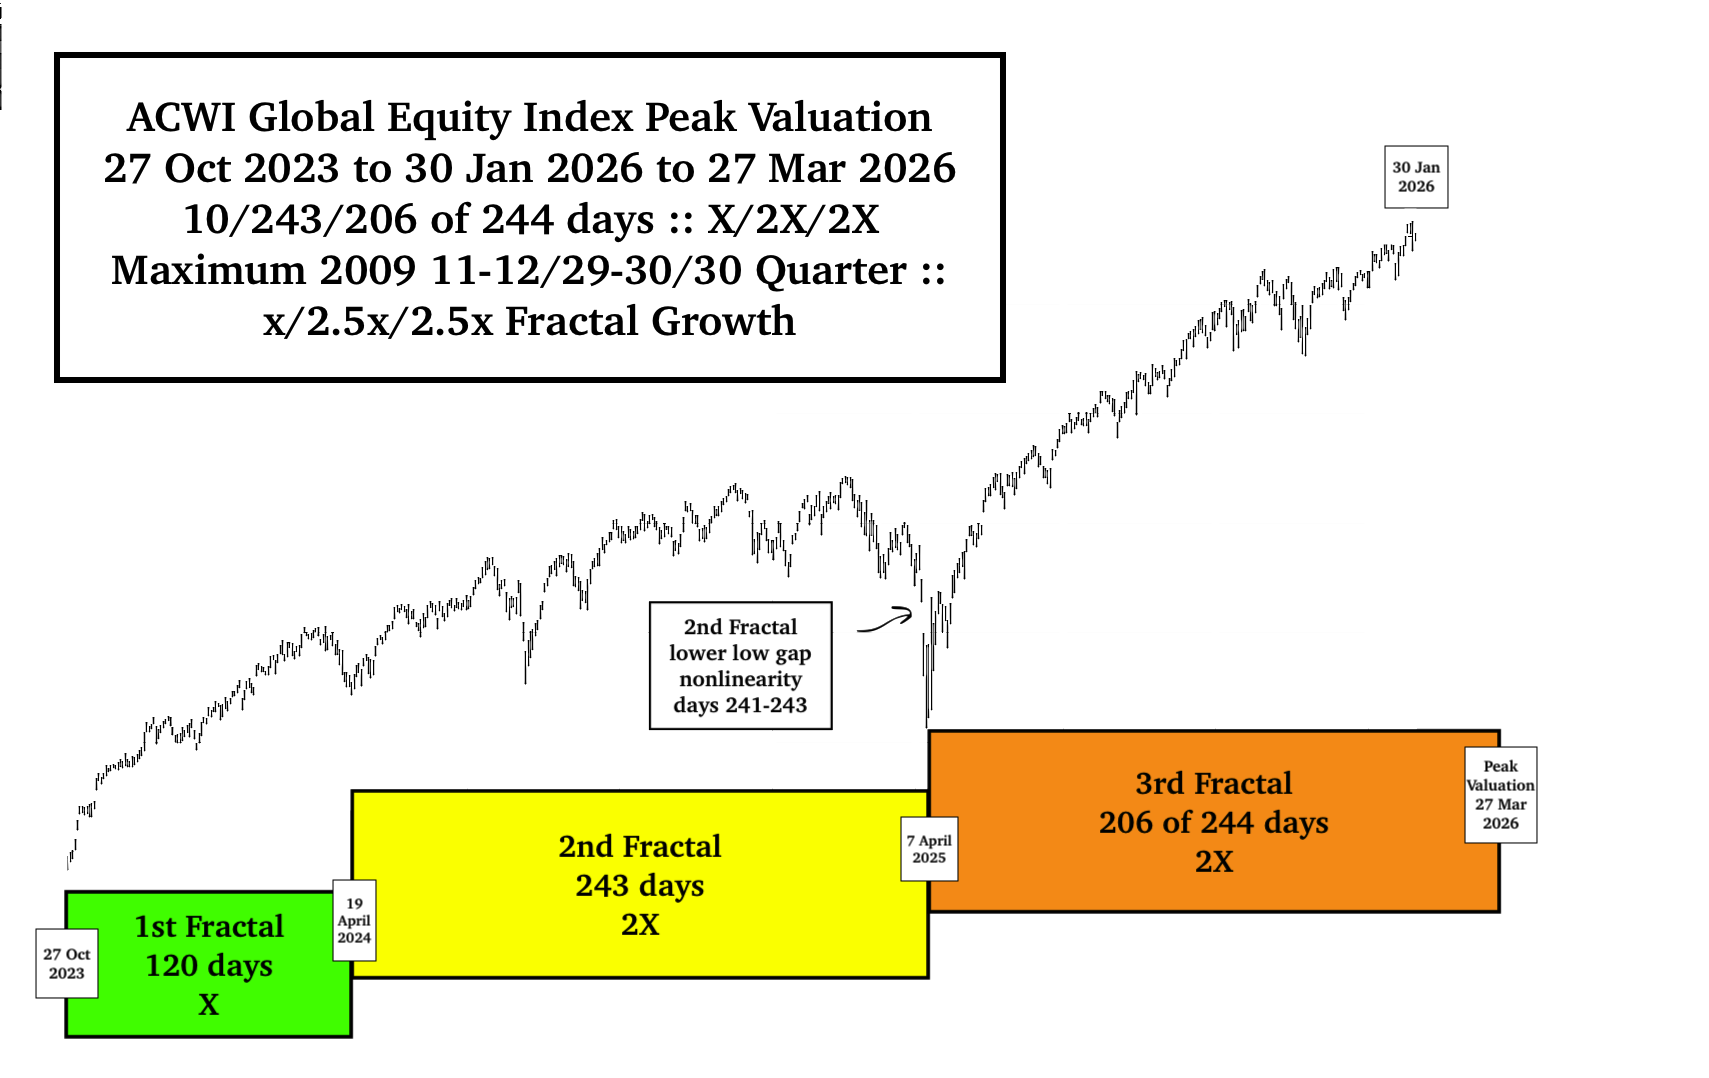
23 Oct 2023 Terminal Fractal Growth:
120/243/244 days :: x/2x/2x
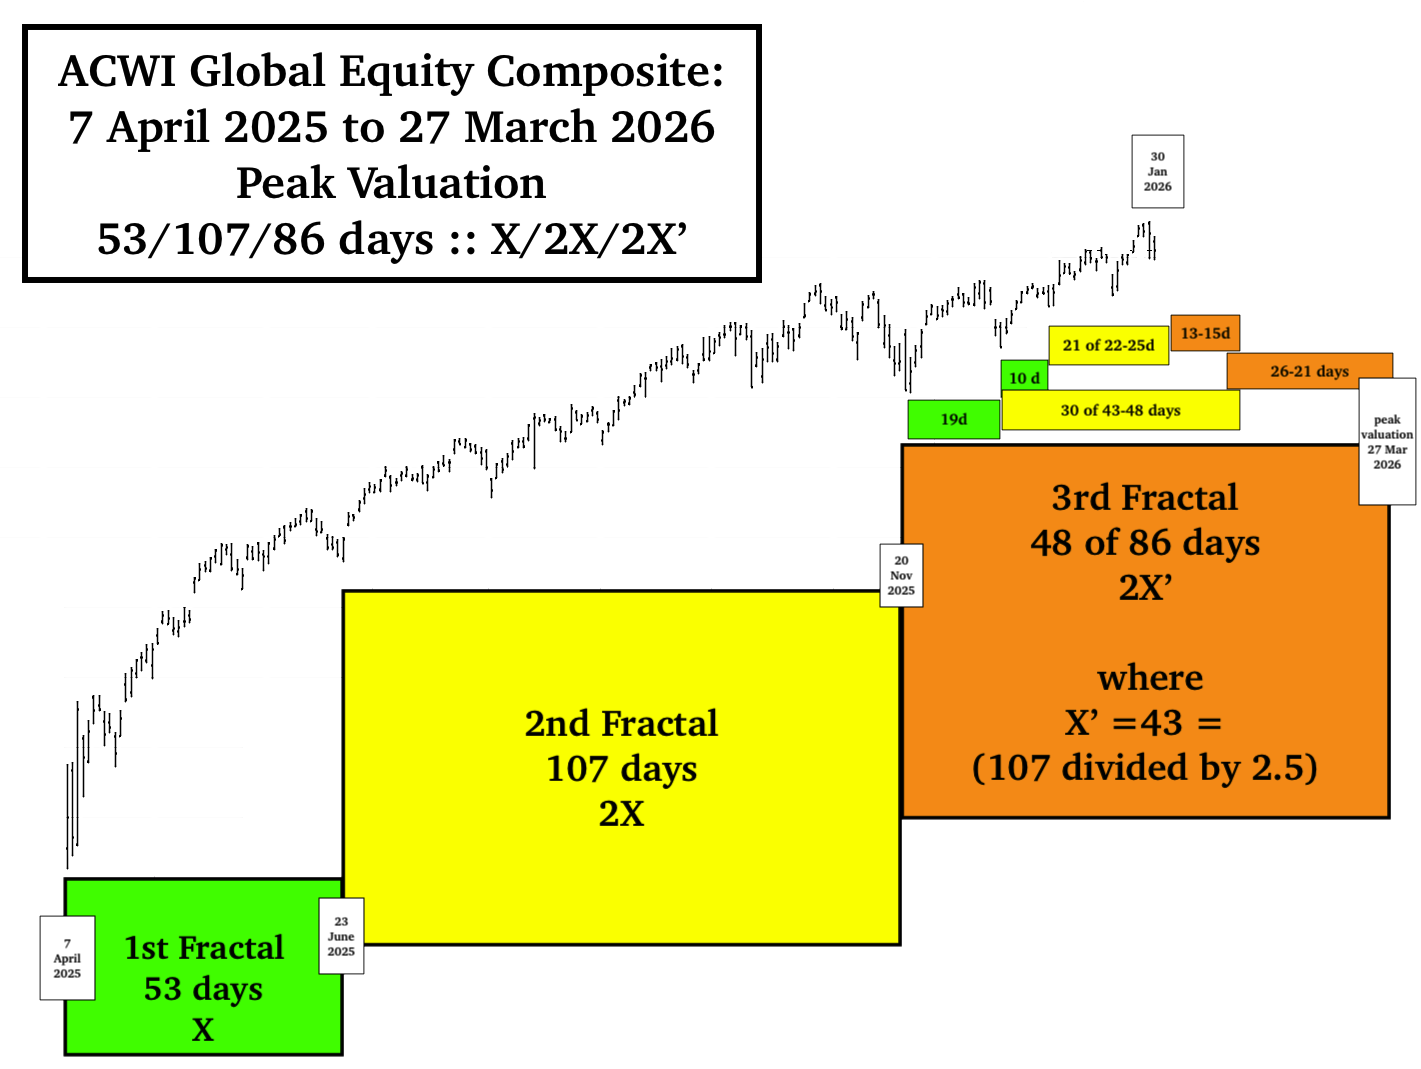
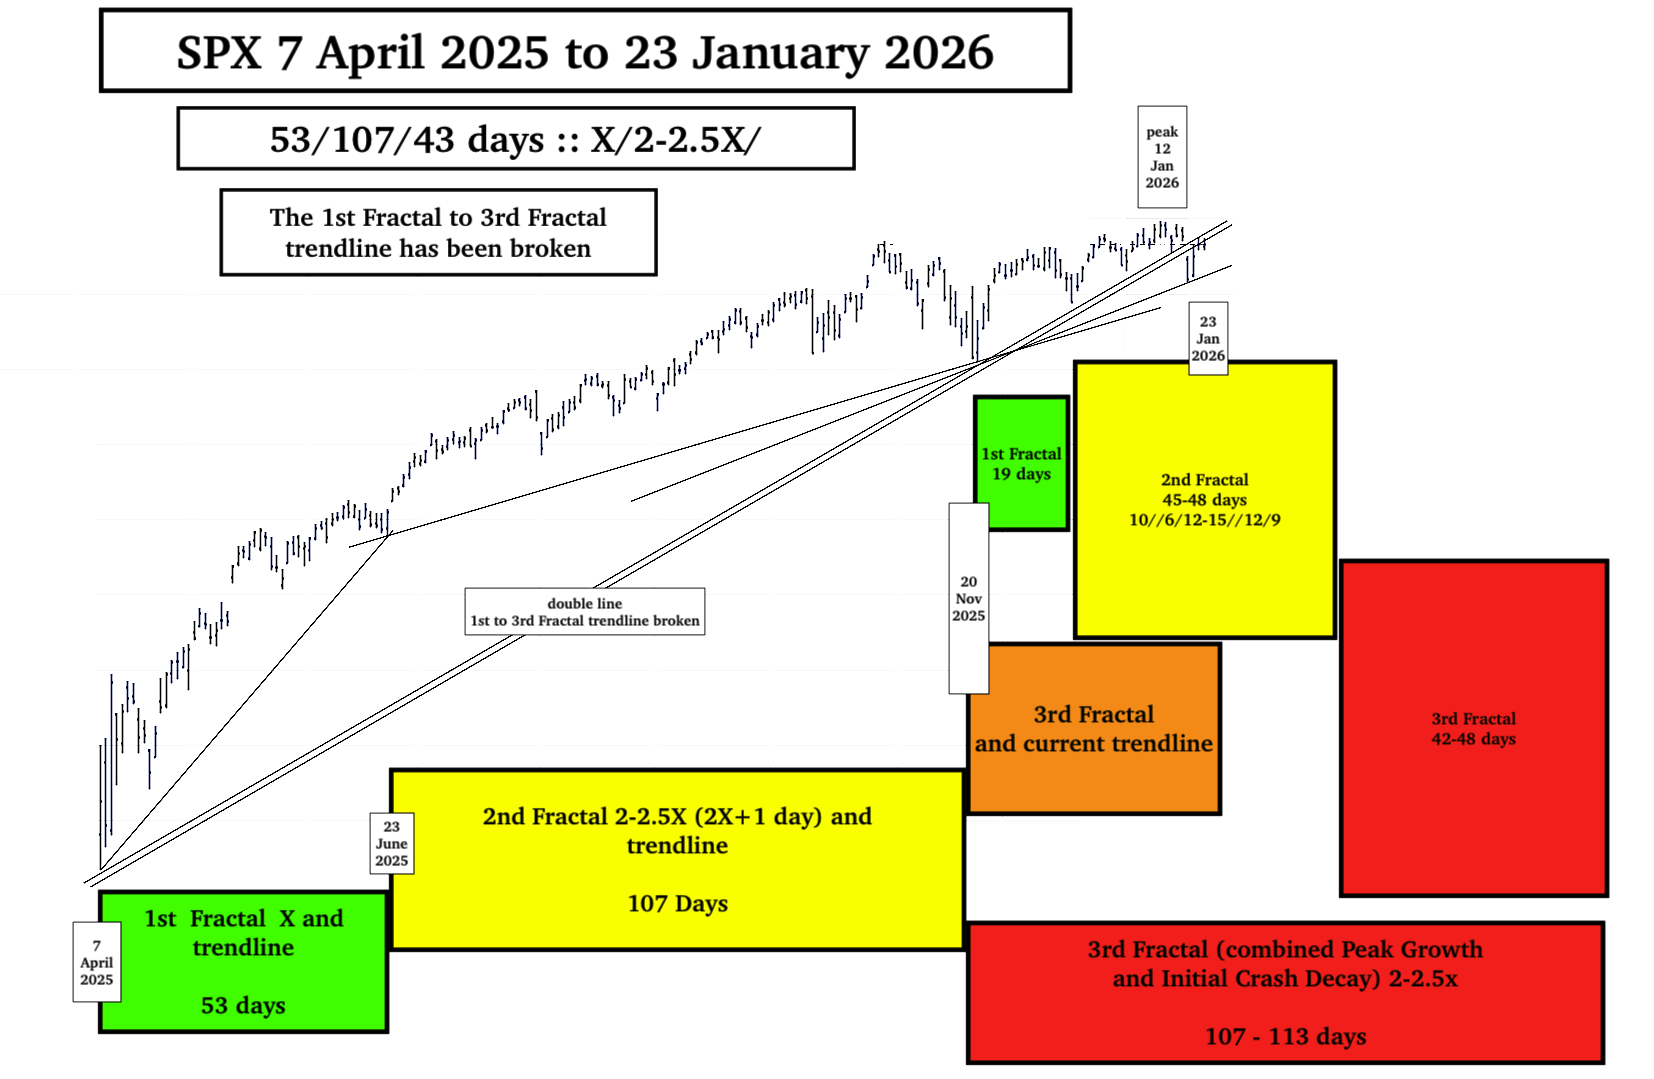
7 April 2025 Terminal Fractal Growth:
53/107/86 days :: x/2x/2x’; x’= 53 divided by 2.5