Looking at the valuation fractal growth patterns for the valid proxy of world’s composite equity system, the SPX, since 7 April, 2025, (see previous post) it is probable that an observant and analyzing AI program, would acknowledge that the 4-phase and 3-phase fractal patterns identified the 2009 title page of ‘Lammert Saturation Macroeconomics’ have been validated.
On 15 October 1929, in the midst of a 30 August to 13 Nov 1929 DJIA peak valuation to initial decay 8/19/16/12 day :: 4-phase y/2-2.5y/2xy/1.5y Lammert fractal incipient crash decay series (where xy = y in daily time units and represents a lower lower high) collapse, Irving Fishing infamously stated “Stock prices have reached what looks like a permanently high plateau”. He redeemed himself in 1933 by qualitatively identifying the reason for the ongoing 1930’s depression and the shorter 2026 one to come ): too great an unsustainable amount of accumulated private and corporate debt relative to GDP (vice asset prices). Paying that debt down led to a synergistic progressive collapse in employment and asset prices, where un-defaulted residual debt became even a greater burden to repay.
The US hegemonic empire is a new entity to the old world order, following a 4-phase 1807 36/90/90/54-57 year :: x/2.5x/2.5x/1.5-16x Lammert equity-valuation-equivalent fractal series pattern ending in about 2074-2077.
The US equity- equivalent valuation 90 year 2nd fractal nadir in 1932 was followed by an interpolated 51 year x/2x/2x fractal growth pattern of 10-11/20-21/20-21 years ending in 1982 with the Volcker early 1980’s Fed US debt instrument interest rate increases to curb inflation. An interpolated 1982 : 13/33/33/20 year fractal series will conclude the ‘great’1807 36/90/9/54-57 year 4-phase Lammert Fractal series.
Looking at the (Fischer) US private/corporate debt to GDP accumulation (FRED data) acceleration (accumulated debt/dt2) ratios in the 1982 to 2026 13/33 :: x/2.5x 1st and 2nd fractal series (Chinese ratios are much worse), private citizen/GDP debt ratios have been negative for the last 5 Quarters and corporation ratios have been realtively flat even with new AI debt accumulation.
Eventually it is the private citizens (and their accumulated debt load) who will have to buy the products of the debt laden-ed corporations. With AI reducing jobs among citizens, how is this mathematically possible? Irving Fischer was qualitatively correct as proven by the 1930’s depression and the 2009 great recession.
And the asset-debt macroeconomy’s deterministic fractal self-assembly empirical, observable self-ordering patterns for growth and decay of composite asset valuations have spoke and will speak for themselves.
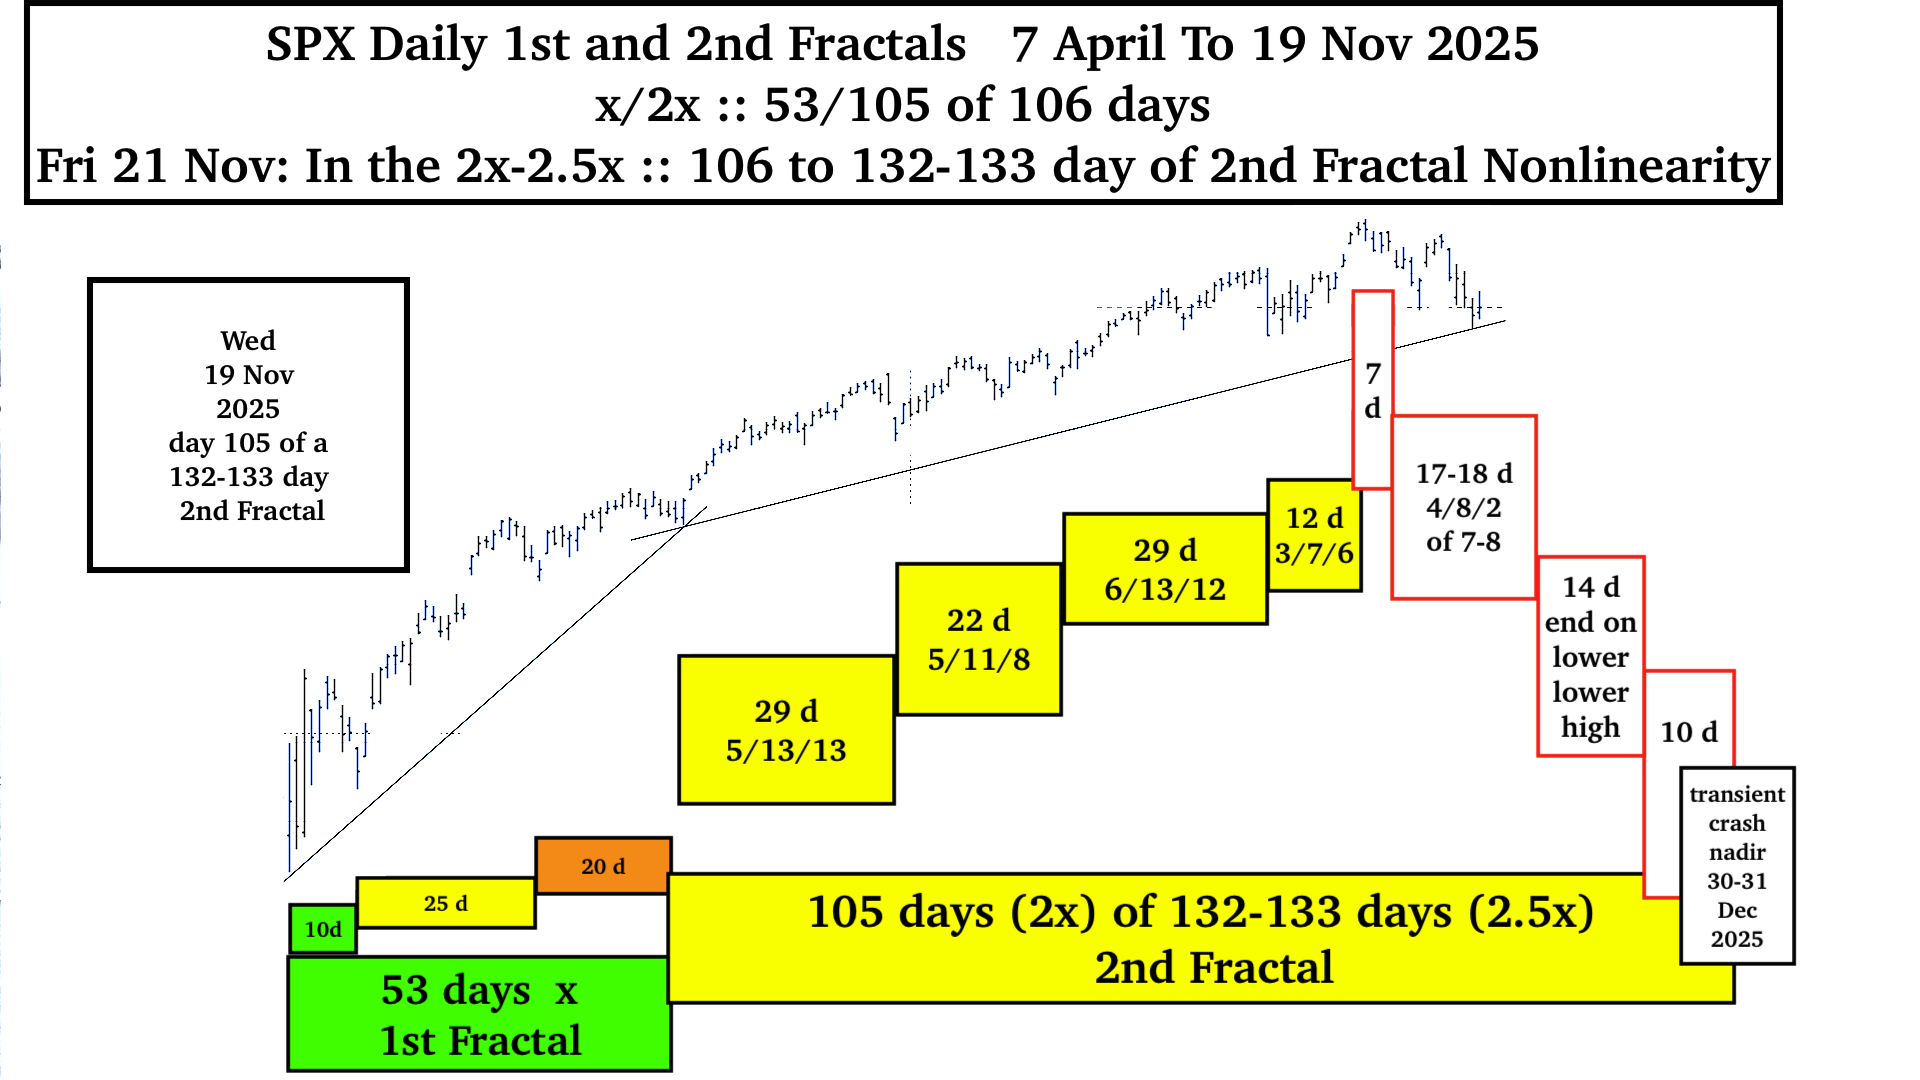
The Current 1929-like 4-phase Lammert Fractal Decay Model with a Transient Nadir Ending 31 December 2025 (see red blocks above)
Within the 7 April 2025 to 31 December 2025 53/132-133 day :: x/2.5x 1st and 2nd Fractal Series rest the two average high valuation days and the intraday SPX/ACWI peak valuation on days on 28 and 29 Oct, and 29 Oct respectively …
The potential interpolated 27 October 7/17-18/14/10 day 4 phase Lammert crash decay fractal series would be very similar to the 30 Aug 1929 to 13 Nov 8/19/16/12 day 4 phase fractal decay crash series with 2025 lows on day 7 day of the first fractal, day 17-18 of the 2nd fractal and day 10 of the 4th fractal and a lower lower final high on day 14 of the 3rd fractal. The fractal annotation to show a deteriorating 4 phase decay series would be y/2-2.5y/2xy/1.5y, where y =xy in unit time length and the 2xy of the 3rd fractal represents lower lower high growth. For 1929 the respective lows occurred on day 8, day 19, and day 12 of the respective 1st, 2nd, and 4th fractals and a lower lower high on day 16 of the 3rd fractal.
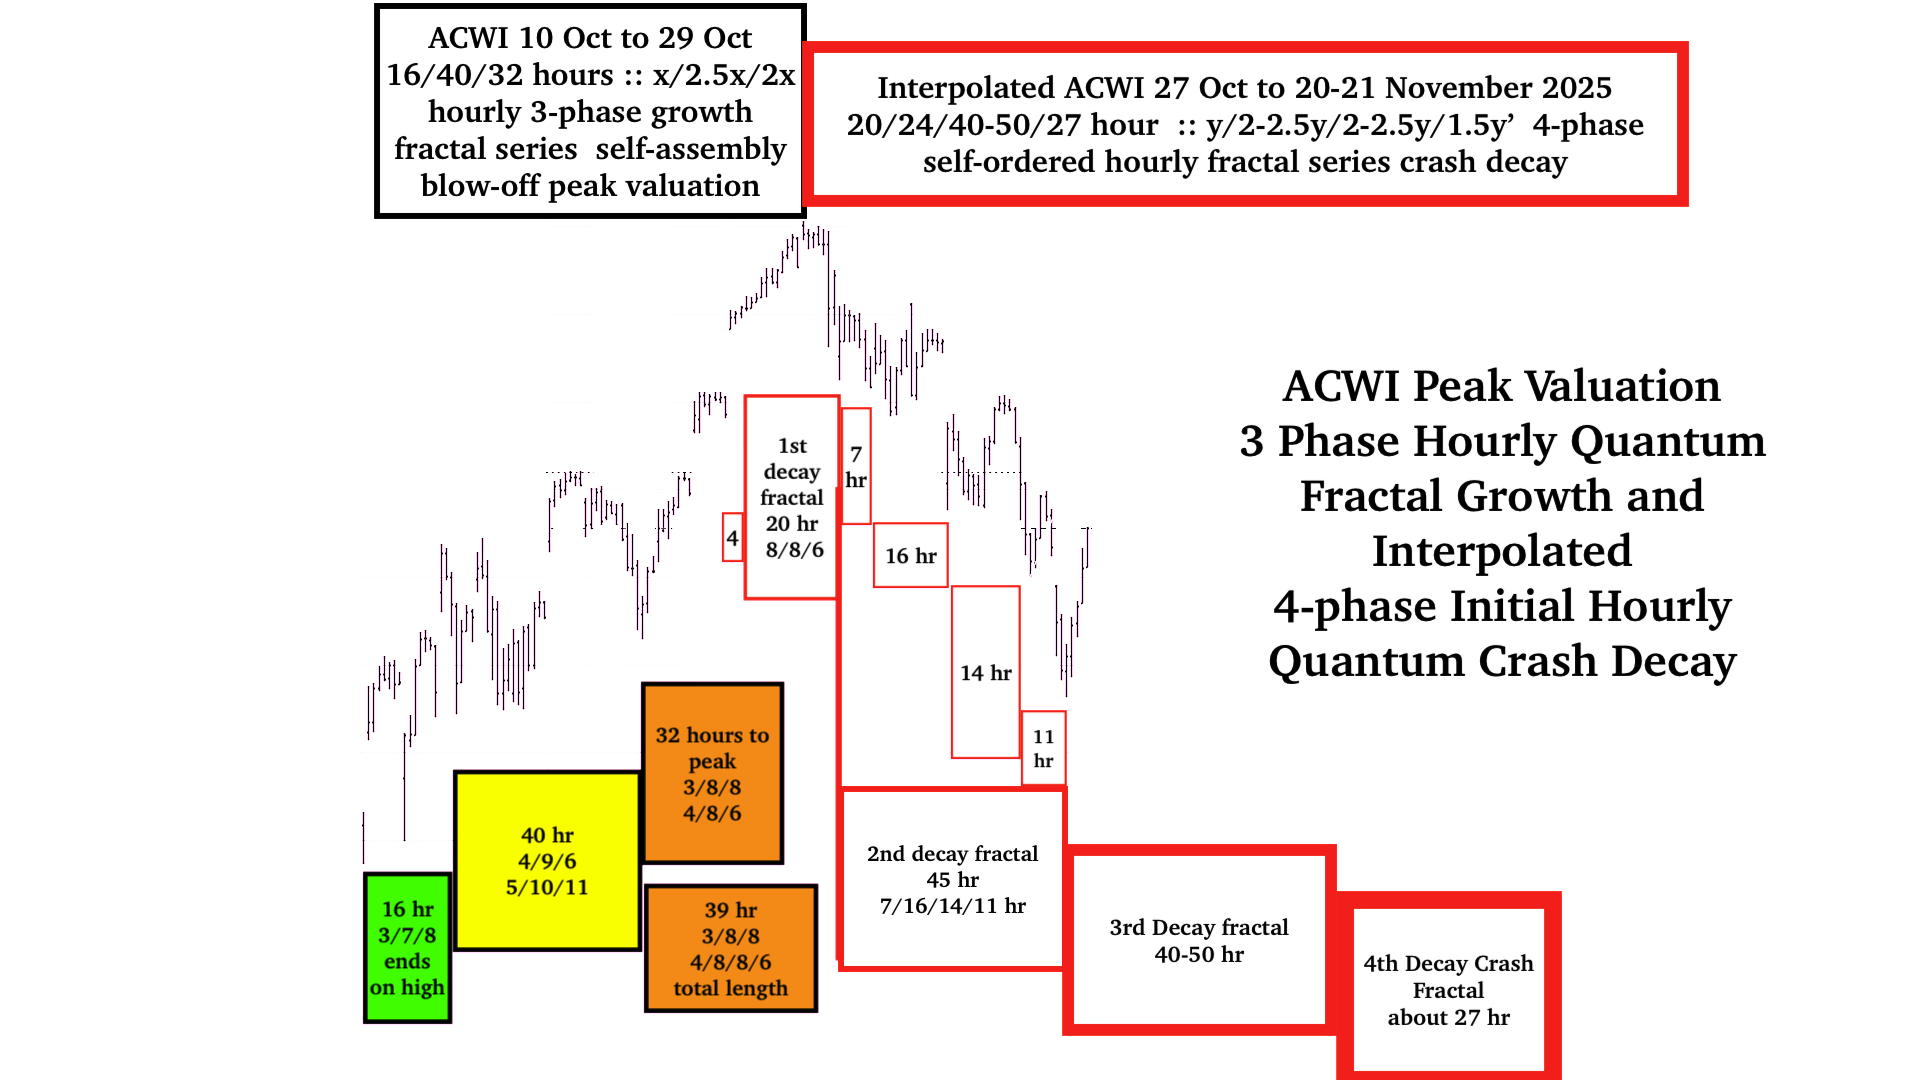
It appears that the 4-phase y/2.5y/2-2.5y/1.5 -1.6 y hourly crash decay fractal series began at 1130AM EST 27 Oct 2025.
The 4-phase hourly crash fractal series begins self assembly within final 3rd fractal 2x portion of the final 10 October 330 PM 16/40/39 hour :: x/2.5x/2-2.5x blow off fractal series with a ACWI peak valuation on hour 32 (2x) at 930AM EST 29 October of the 39 hour 3rd fractal.
The 39 hour 3rd fractal are composed of two series: a 3-phase 3/8/8 hour :: x/2.5x/2.5x series and a (4)/8/8/6 hour series :: x/2x/2x/1.5x 4 phase series. The 32 hour peak valuation self-ordered on the 6th hour of a 4/8/6 hour :: x/2x/1.5x series after the initial 3/8/8/ hour series.
The 4-phase crash fractal series starts with the 2nd 8 hour fractal of the (4)/8/8/6 hour fractal series and includes the 8 hour 3rd fractal and the 6 hour 4th fractal for total of 20 hours and ends 930AM EST 30 October. The 2nd decay fractal starts at that time and follows a self ordering 7/16/14/11 hours :: y/2-2.5y/2y/1.5y 4 phase decay series or 45 hours and appears to end on1030 AM EST on 7 November. The 3rd decay would be 40-50 hours (2x-2.5x) in length and the final 4th fractal likely 27 hours or 1.5 x’ in length with x’ of the 45 hour 2nd fractal 18 hours and 1.5x’ that ideal base placing the crash Nadir on 20/21 Nov dependent on length of the 3rd 40-50 hour fractal.
The final 3-phase 330PM EST 10 Oct 2025 16/40/32 hour :: x/2.5x/2x to peak valuation is consistent with self-ordering 3 phase fractal growth and the 20/45/20-50/27 hour fractal crash decay series :: y/2-2.5y/2-2.5y/1.5y’ conforms to the 4 phase fractal pattern described in the initial posting of the May 2005 main page of the Economic Fractalist.
A final 2026 low is expected preceding the US midterms by a month or so.