What is the correct and observable self assembly fractal pathway to the 1982 13/33 year global equity peak valuation and thereafter to the incipient crash low?
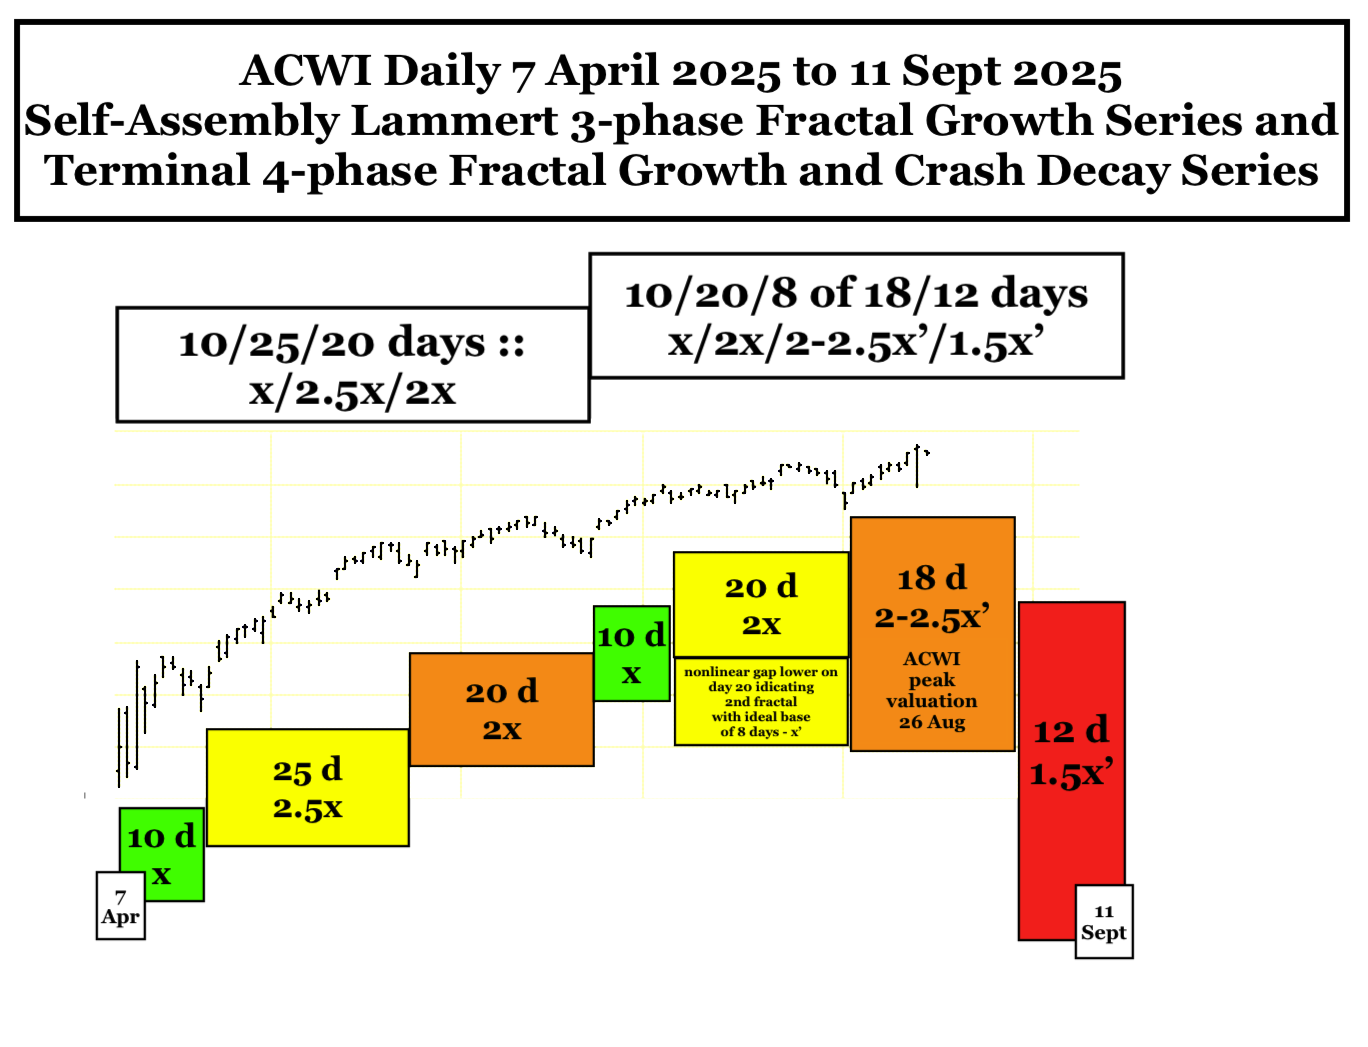
The gapped nonlinear lower low on 1 August 2025 identifies the preceding 20 day fractal grouping as a 2nd fractal. The ideal base for a 20 day 2nd fractal is 8 days = x’. The observable base is 10 days starting on 23 June, the same nadir day that concluded a 7 April 2025 10/25/20 day :: x/2.5x/2x fractal growth series.
The peak range of a 3rd fractal with an 8 day base is 2-2.5x’ or 16-20 days with a 4th fractal of 1.5x’ or 12 days. The 3rd fractal appears to be a 1 August 2025 4/7 of 8/8 day fractal growth series with a peak on day 18 or 26 August 2025. A 12 day 4th fractal crash decay would place the crash nadir on 11 September 2025.
On 3 Sept 1929, the DJIA average reached a peak valuation of 381.17. Ninety-six years later (97 by fractal count) on 23 July 2025, the DJIA reached a peak valuation of 45073.63, about 118 times the previous century’s earlier peak valuation. The average US house in 1929 was about 6000 US dollars and in 2025 about 515000, a comparable 85.5 times fold increase in valuation.
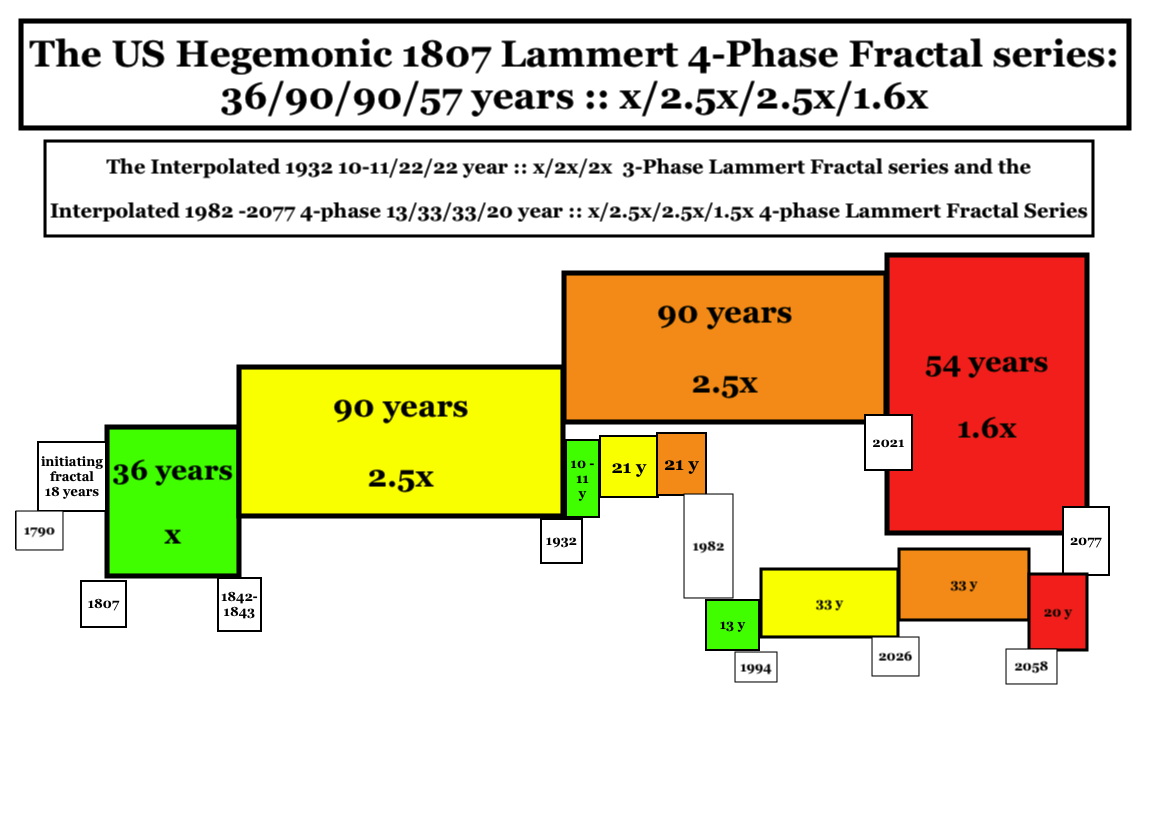
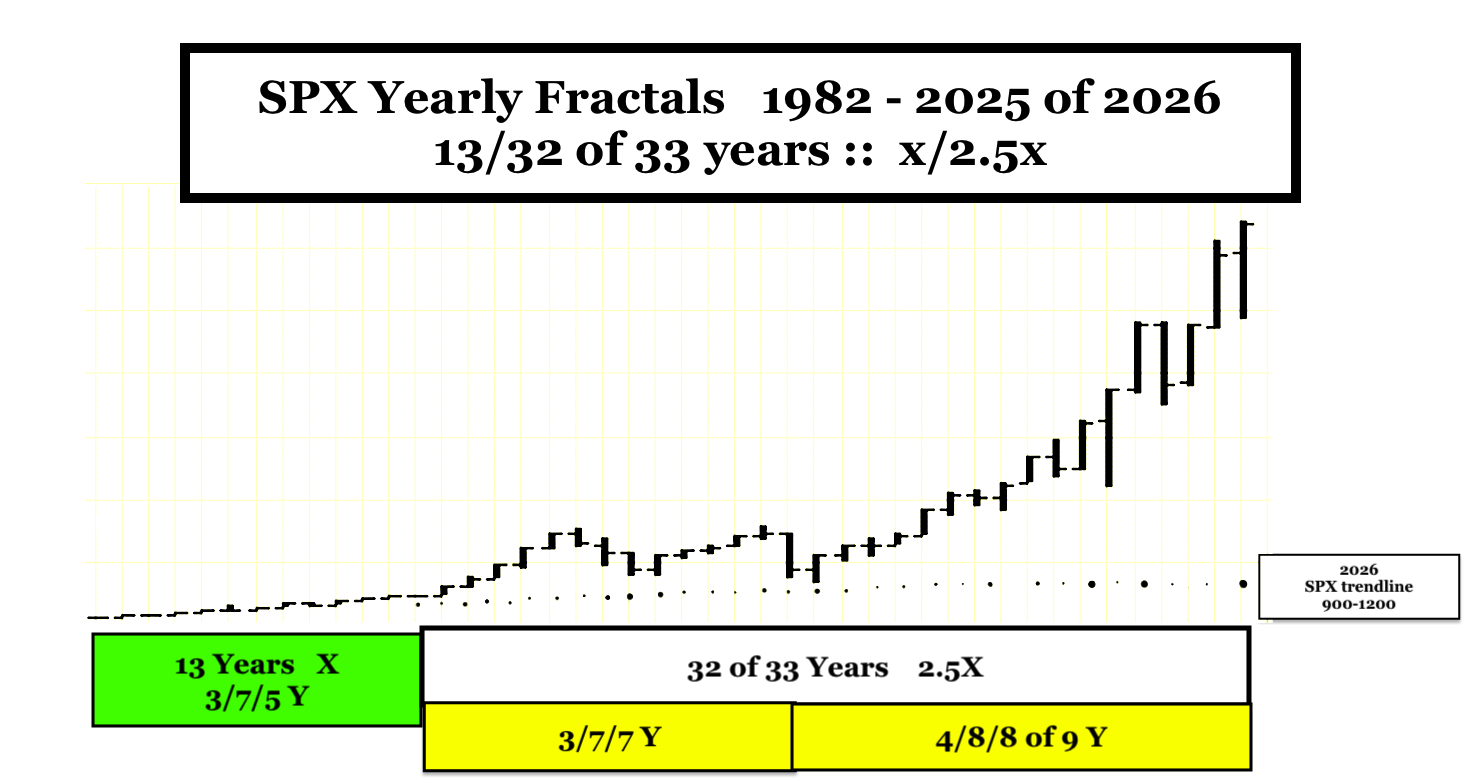
The DJIA valuation peak in 1929 was near the close of a US 1807 to 1932 :: 36/90 year first and second fractal series … and the peak valuation in 2025 near the close of a US 1982 to 2026 13/33 year first and second fractal interpolated series, part of the greater US 1807 36/90/90/54 year :: x.2.5x/2.5x/1.5x 4-phase fractal series with a 90 year third fractal peak in Nov 2021.
Going into a population-overdebt-burdened-related, asset-highest-ever-valuation-related, highest-consumer-product-cost(except vehicle fuel), tariff-and-US consumer-paid-for-related … recession … Nvidia’s PE ratio is currently about 59 and Microsoft’s 38, both perfectly valued on a daily basis, but grossly overvalued in the long term credit cycle basis.
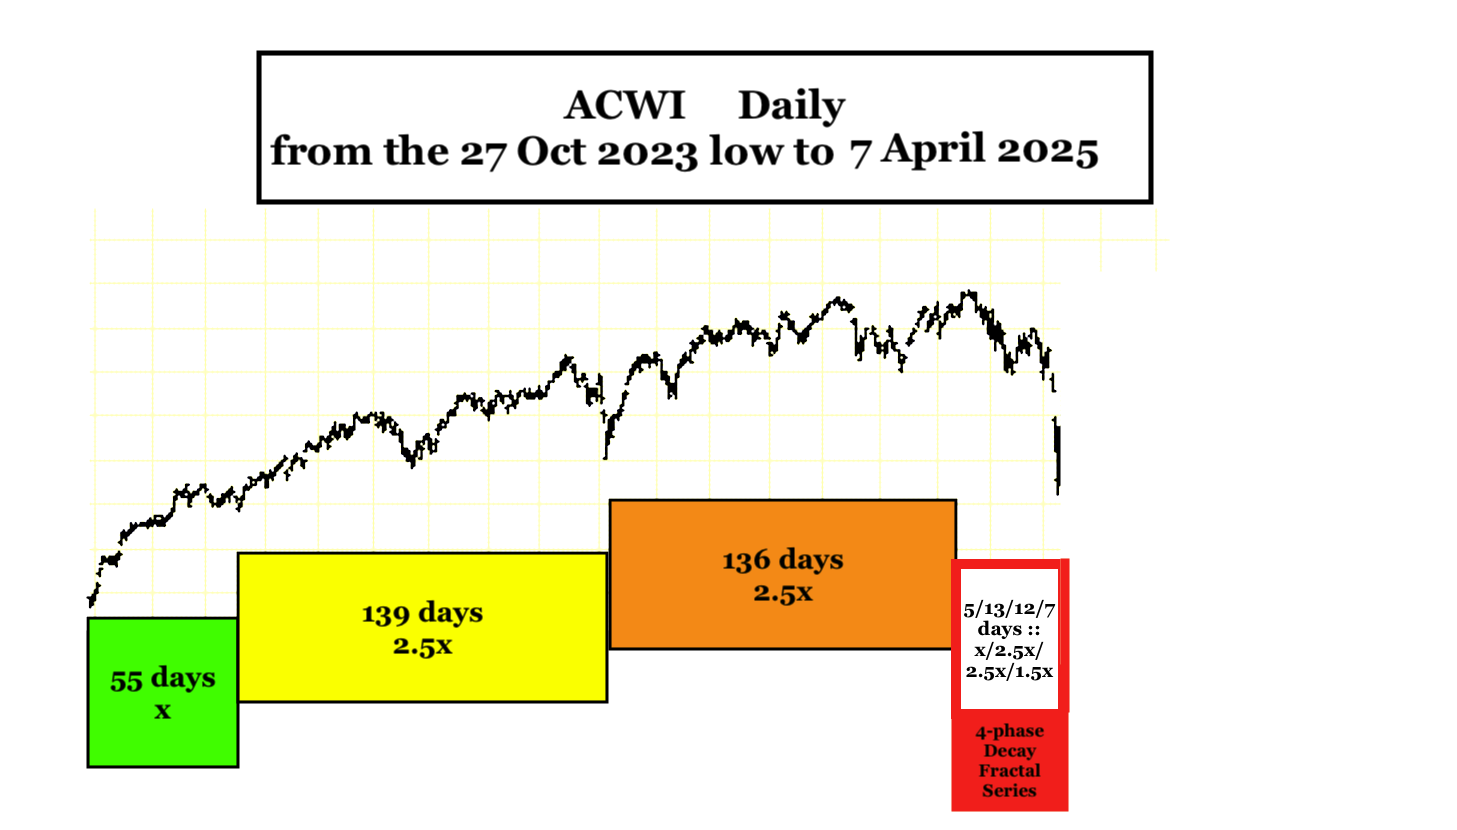
From the 27 Oct 2023 low the Global Equity ACWI propelled by historical deficit to GDP annual credit/money expansion followed a 3 phase x/2.5x/2.5x maximum valuation growth fractal progression of 55/139/136 days followed by a 4 phase 5/13/11/7 day decay fractal series ending 7 April 2025.