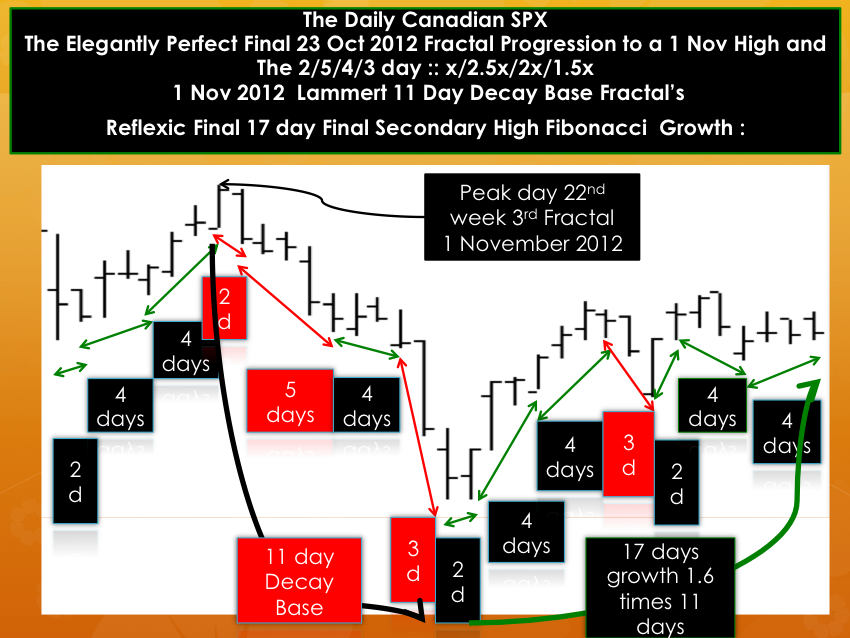
!929 Fractal Decay Revisited: 1 November 2012 11/27-28/27-28 days …
!929 Fractal Decay Revisited: 1 November 2012 11/27-28/27-28 days …
Observe the Lammert Time Based Asset Valuation Quantum Self Assembly Fractals composing the Asset Valuation Saturation Curves . From 23 October to 1 November 2/4/4 days :: x/2x/2x From 1 Nov to 15 Nov (the decay base fractal ) 2/5/4/3 days :: x/2.5x/2x/1.5x And the first of two fractal series composing the Fibonacci reflexic maximum growth of 17 days in a deteriorating bad debt liquidating self assembly asset debt economic system: From 15 November 2012 to 28 November 2/4/4/3 days :: x/2x/2×1.5x and the second series from 28 November to 7 December 2/4/4 days :: x/2x/2x …. This is a deterministic quantum fractal self assembly asset debt macroeconomic system.
From the Main Page of TEF:
The ideal growth fractal time sequence is X, 2.5X, 2X and 1.5-1.6X. The first two cycles include a saturation transitional point and decay process in the terminal portion of the cycles. A sudden nonlinear drop in the last 0.5x time period of the 2.5X is the hallmark of a second cycle and characterizes this most recognizable cycle. After the nonlinear gap drop, the third cycle begins. This means that the second cycle can last anywhere in length from 2x to 2.5x. The third cycle 2X is primarily a growth cycle with a lower saturation point and decay process followed by a higher saturation point. The last 1.5-1.6X cycle is primarily a decay cycle interrupted with a mid area growth period. Near ideal fractal cycles can be seen in the trading valuations of many commodities and individual stocks. Most of the cycles are caricatures of the ideal and conform to Gompertz mathematical type saturation and decay curves.


