Saturation Macroeconomics: The Fractal Quantum Self Assembly Countervailing Debt-Asset System: the Patterned Science of the Global Macroeconomy
Monthly Archives: June 2012
Saturation Macroeconomics: The Fractal Quantum Self Assembly Countervailing Debt-Asset System
Asset-Countervailing-Debt Saturation Macroeconomics: Before the Global System’s June-July-August Third Fractal Blow-Off: The Nikkei’s 97 Day 4 June Second Fractal Nonlinear Low
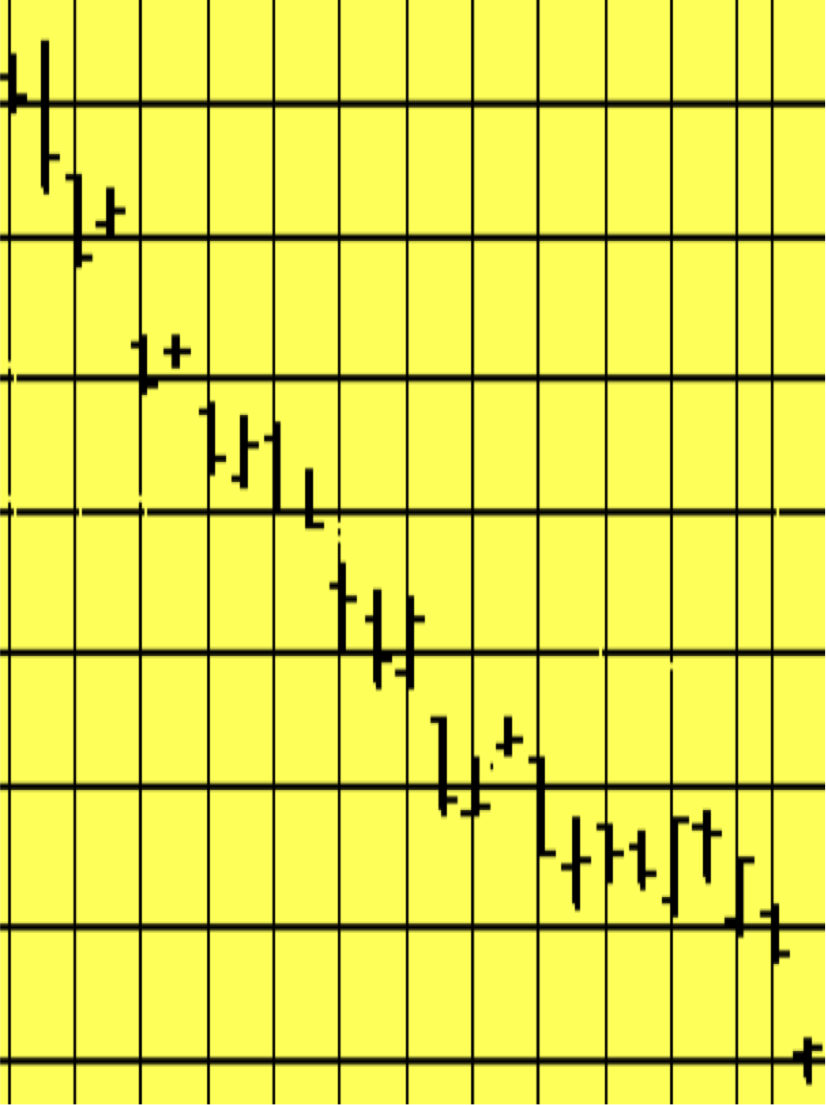
The Nikkei 26 April to 4 June 2012 Gompertz Lammert Decay Fractal of 5/11/11 days :: y/2-2.5y/2-2.5y … clearly shows, on a daily basis, the second fractal characteristic lower low nonlinear daily gap (see the main page of TEF) – ending the 97 day second fractal with a 17 November 2011 7/17/17 day or 39 day base.
Japanese debt and countervailing assets are part of the global self assembly debt -asset valuation system. The Nikkei’s valuation is restricted by its relatively proportionally greater parochial debt.
The 4 June 2012 Nikkei second fractal low came within a 1/8 of a percent of its 25 November 2011 first fractal low.
What is remarkable about this new patterned mathematical science of countervailing debt-asset self assembly saturation macroeconomics is that the one quadrillion equivalent system in its entirety can be understood with surprising clarity.
The Deterministic Self Organizing Quantum Debt-Money-Asset Macroeconomic System: The 3 May – 1 June 2012 Simultaneous y/2-2.5y/2.5y:: 4/9/10 Day Gompertz Decay Terminus and the 19 Dec 2011 114 Day Second Fractal Gap Lower Low Nonlinear Terminus
Reference: 1. 9 May 2009 http://theeconomicfractalist.blogspot.com/
Lammert Nonstochastic Saturation Macroeconomics
This blog explores the new science of nonstochastic saturation macroeconomics, a major observational discovery. The macroecomony is a self balancing complex system of assets and debt operating according to simple mathematical laws of growth and decay of its asset valuation curves:: X/2.5x/2x/1.5x and y/2-2.5y/1.5-2.5y
Reference 2: 15 My 2005 From Main Page The Economic Fractalist: http://www.economicfractalist.com/
A sudden nonlinear drop in the last 0.5x time period of the 2.5X is the hallmark of a second cycle and characterizes this most recognizable cycle. After the nonlinear gap drop, the third cycle begins. This means that the second cycle can last anywhere in length from 2x to 2.5x.
On 20 May it was predicted that US the ten and thirty years would reach historical low interests on 23 May. http://seekingalpha.com/
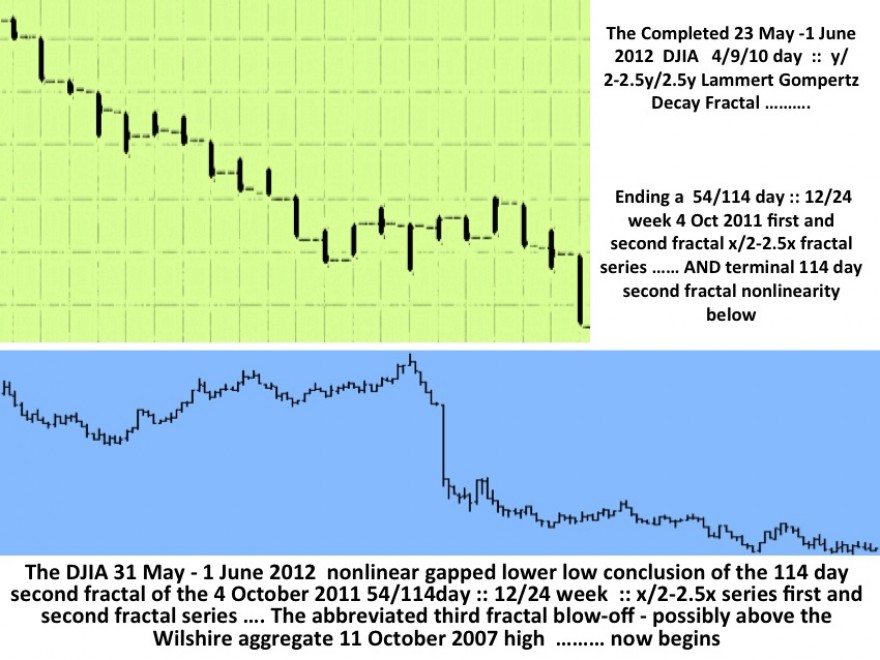
While that date was not the low, nor did the thirty year note reach a historical low, 230 year historically low rates for the US ten yer note did occur on 30 May 2012 with lower historical rates on 1 June. The debt instrument’s decline in interest percentage (or rise in asset value for previously owned US debt) followed the system’s countervailing equity asset class with a near ideal Wilshire Gompertz-Lammert decay curve of 4/9/10 days :: y/2.5y/2.5y.
The terminal day of this 4/9/10 day Gompertz decay fractal exactly matched the timing of the Wilshire’s (the global debt-money-asset system’s largest composite equity class and proxy for all of the global system equity classes) 4 October 2011 x/2-2.5x first and second fractal series of 54/114 days and x/2x :; 12/24 weeks with the characteristic second fractal nonlinear gap lower low between 30 May 2012 and 1 June 2012, the 113th and 114th days of the 19 December 2011 114 day second fractal.
1 June 2012 was the global debt-money-asset system’s second fractal equity low and countervailingly, the US Ten year Note, the system’s quality long term debt instrument’s, valuation high (230 year historically low interest rate.)
The system will now proceed to an equity blow-off over the next 11-13 weeks – as money exists the debt instrument money-equivalent pool and enters into the equity money-equivalent pool.
This is a global debt-money-asset macroeconomic system.
The Wilshire represents the tax favored equity composite of the hegemonic dominate nation and relatively a strong currency as compared to the imploding Euro system and currency and compared to Japan with its high debt/GDP ratio and its representive Nikkei following a weak November 8-9/21 week :: x/2-2.5x fractal series and over 90 percent lower in real terms from its 40,000 high 22 years ago.
Global money will flow toward the stronger hegemonic system over the next 11-13 weeks with a possibility of a blow off in the Wilshire above its prospectively predicted 11 October 2007 nominal high.
From 1 June 2012 the world can now observe prospectively the global debt-money-asset system’s quantum daily asset valuation fractal progression of its tax-advantaged favored equity class to the system’s US hegemonic equity class 70/155 year :: x/2-2.5x high.
How quantum fractally elegant, how mathematically precise is the debt-money-asset system? (Click on the blue graph of 31 May – 1 June 2012)
Kindly observe the exquisitely elegant final decay pattern on 1 June 2012 ending the second 19 December 2012 114 day second fractal and the 3 May 4/9/10 y/2.5y/2.5y decay fractal.
After the nonlinear drop early on 1 June 2012 and an initiating fractal of 6 five-minute time units observe Gompertz final decay of 15/38/23 five-minute fractal time units of y/2.5y/1.5y; the debt-money-asset macroeconomic system is an incredibly finely ordered fractal mathematical system.)
Reference: 1. 9 May 2009 http://theeconomicfractalist.blogspot.com/
Lammert Nonstochastic Saturation Macroeconomics
This blog explores the new science of nonstochastic saturation macroeconomics, a major observational discovery. The macroecomony is a self balancing complex system of assets and debt operating according to simple mathematical laws of growth and decay of its asset valuation curves:: X/2.5x/2x/1.5x and y/2-2.5y/1.5-2.5y


