The synchronous East and West, Chinese and US, equity market Crash of 2025 thru 2026 are an asset-debt macroeconomic system quantitative time-based fractal inevitability. It may be difficult to convince most observers that the Great Global Crash was only made significantly worse by a trade war – not precipitated by one.
The East: China: The Shanghai Composite Index(SCI)
The Elegant Self-Ordering Quantitative Fractals of the SCI
Under the strong guidance of the CCP, China has become the largest manufacturing country in the world. As opposed to the former Soviet Union leadership whose near sole focus was on military production to compete, the CCP has focused on the development and expansion of a broad industrial base to claim a leadership role in global affairs.
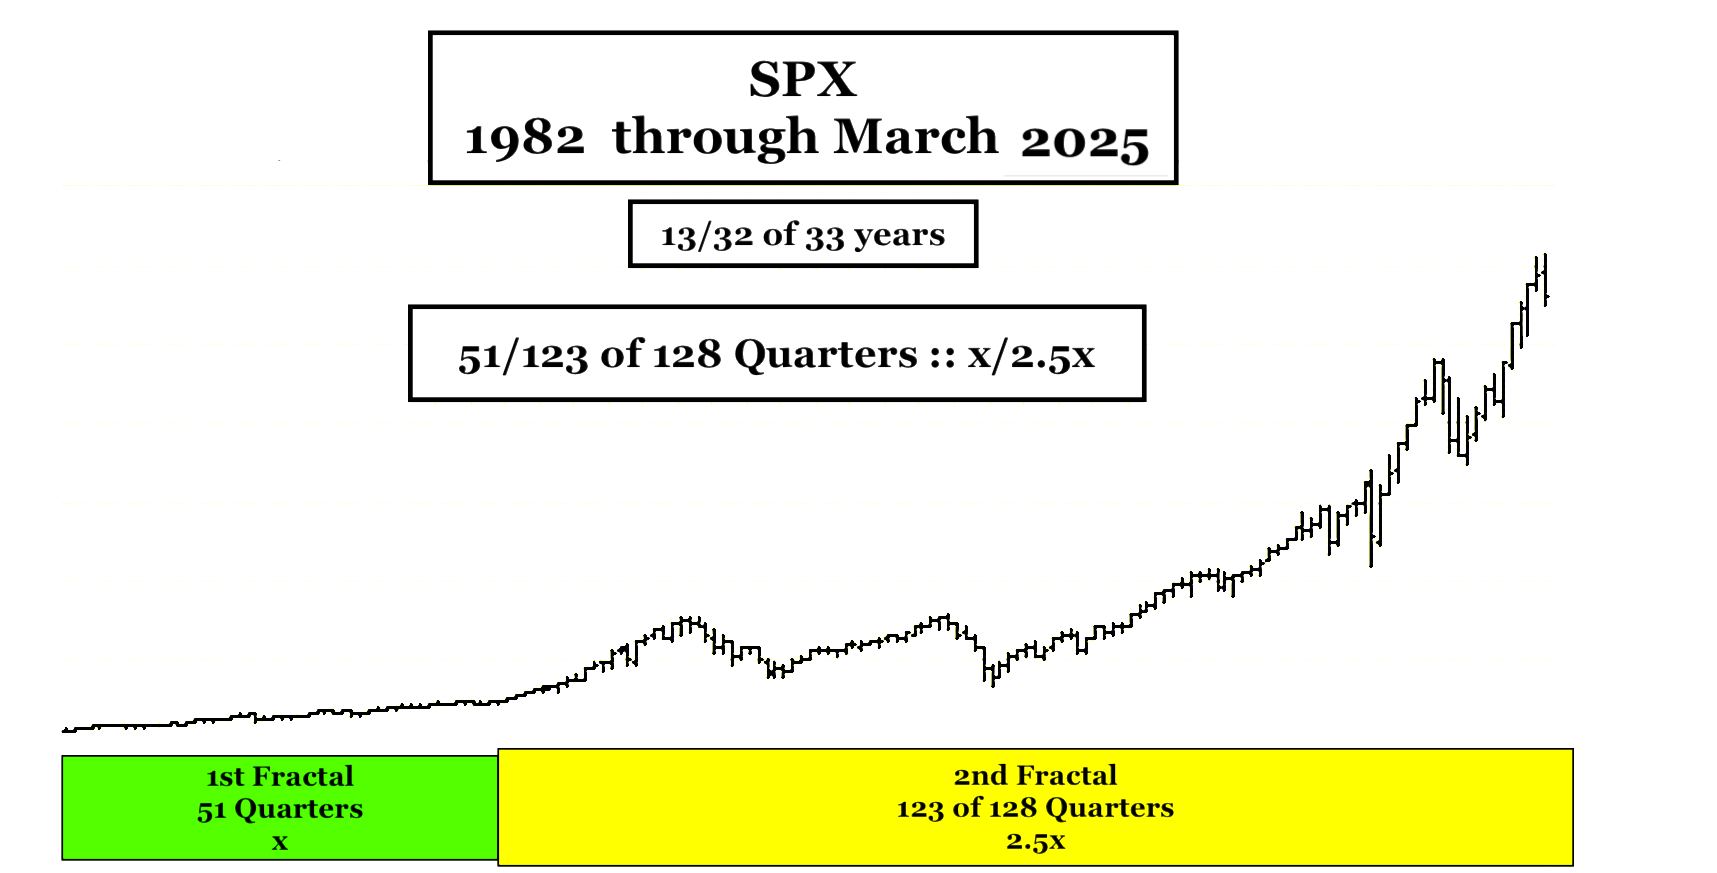
The Shanghai Composite Index(SCI)has a decidedly different fractal valuation growth and decay pattern from the US SPX 1982 13/32 of 33 year fractal pattern.
Nevertheless on a 35 year scale, the SCI started from a 1994 nadir similar to the SPX with a 30 year valuation growth peak on 16 Oct 2007 at about 6100. Over 17 years later it is now about at 3240, 47% below its 2007 peak valuation with a most recent 8 Oct 2024 lower high valuation of 3674 or about 40% below its 2007 peak valuation. By comparison the SPX peaked at 6147 on 19 Feb 2025 about 400% above it 2007 peak valuation. The US hegemony advantaged with its alliances and with its ownership status of the world’s reserve currency has been a vortex for global capital flow into its equity markets.
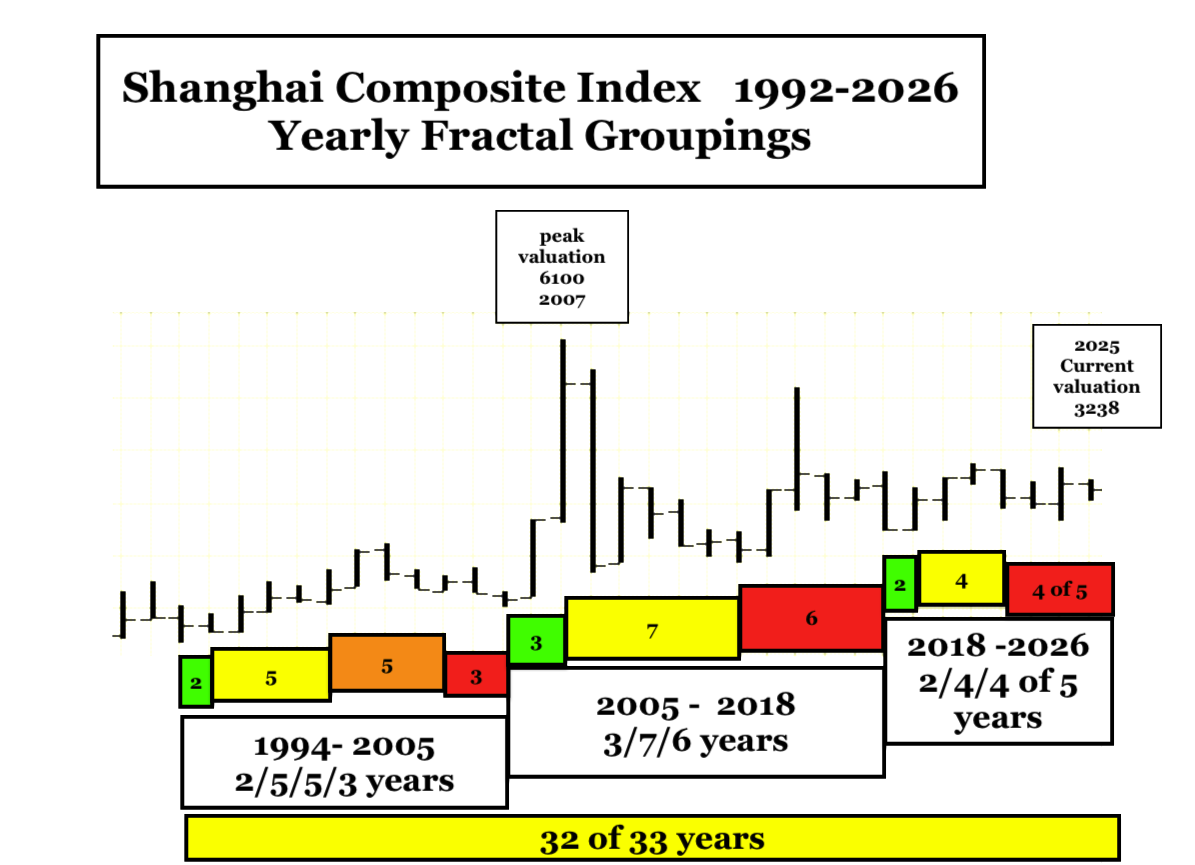
The SCI yearly fractal groupings since 1994 are 2/5/5/3 years, 3/7/6 years, and 2/4/4 of 5 years. The total of the fractal groupings is 32 of 33 years and will be synchronous with the length of the 1994 to 2026 SPX 33 year 2nd fractal.
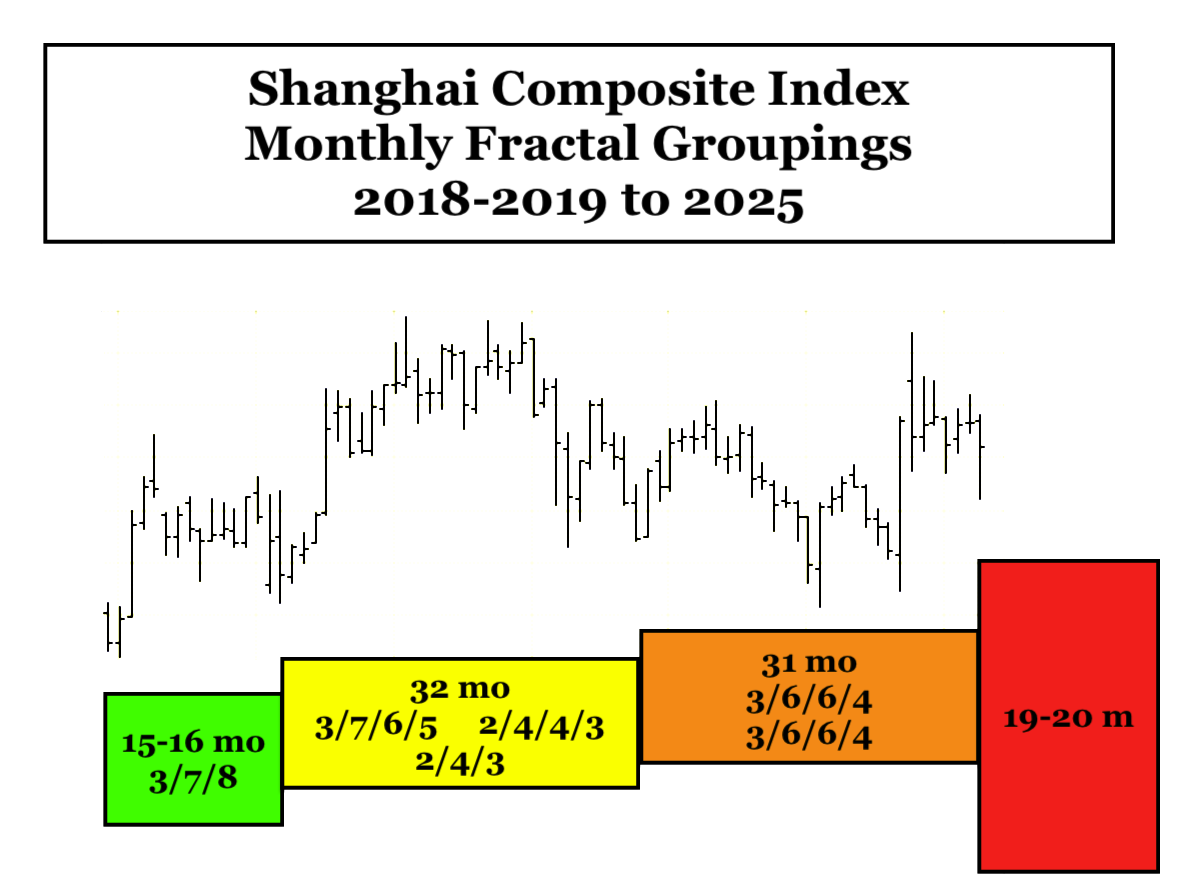
The last SCI yearly fractal grouping of 2/4/4 of 5 years can be observed on a monthly basis to be 15/32/31 of 31/19-20 months :: x/2-2.5x/2x’/1.5-1.6x’ with x’ of the 32 2nd fractal equaling 13 months and 1.5-1.6x’ equaling 19-20 months for completion of the 4th fractal in 2026. The red 19-20 month 4th decay fractal represents the implosion of the overproduced, overvalued bubbled Chinese residential property market, a domestic purchasing recession, restructuring of debt and devaluation of assets.
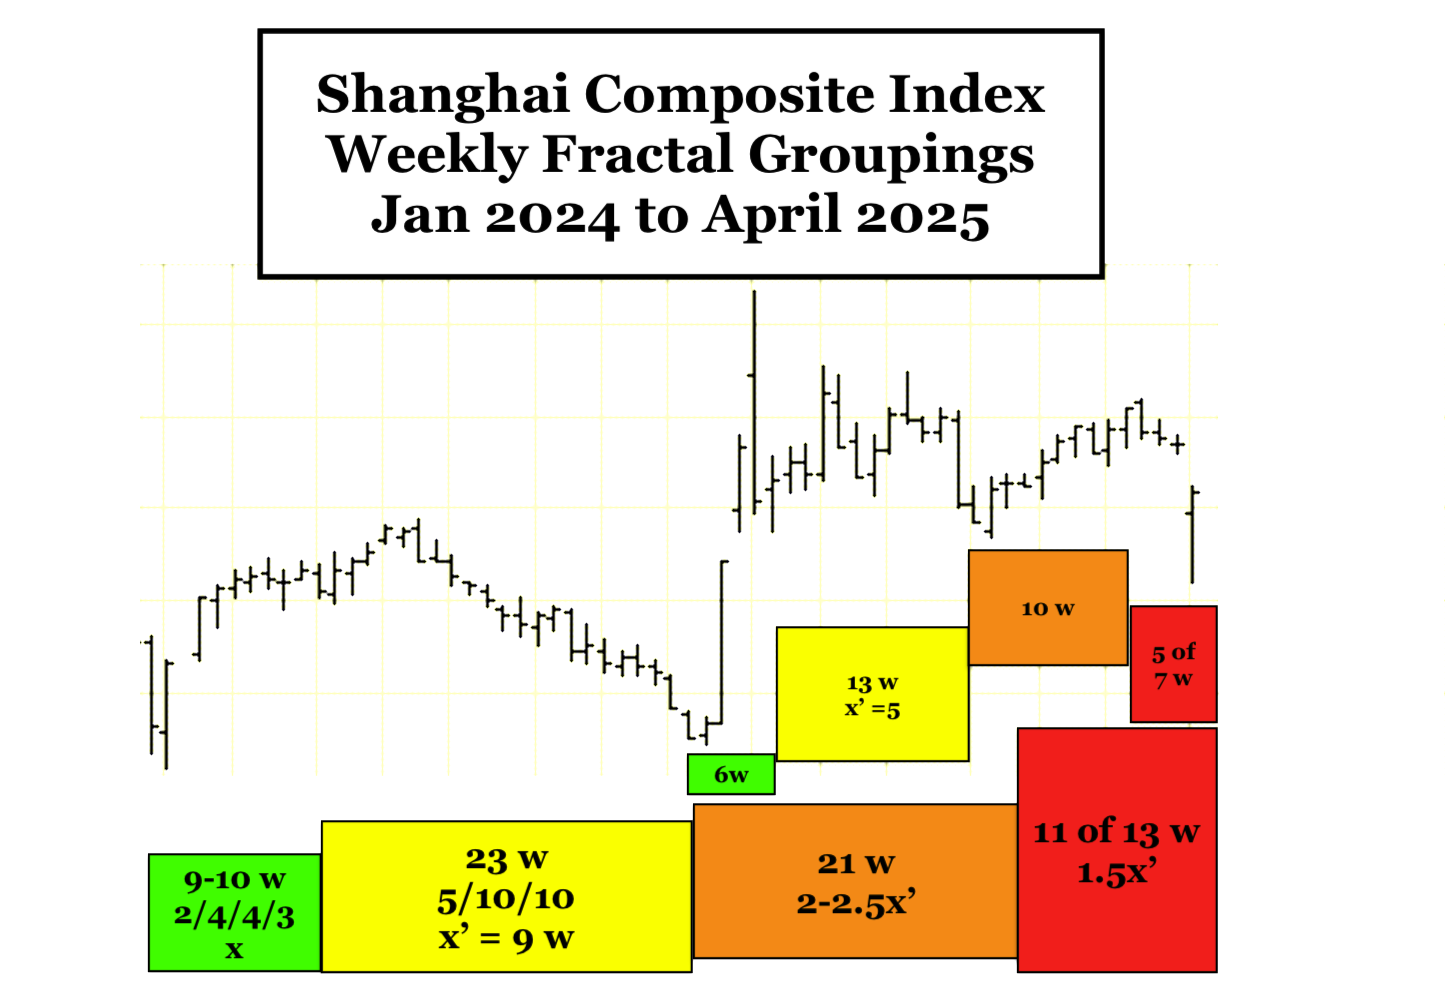
The SCI’s 3rd fractal of 31 months above can be observed on a weekly basis to be 10//23-24//(5-6/13/10/5 of 7) weeks with the sum of the 1st and 2nd fractals 32-33 weeks equaling the the sum of the interpolated 3rd and 4th fractals, 33 weeks.
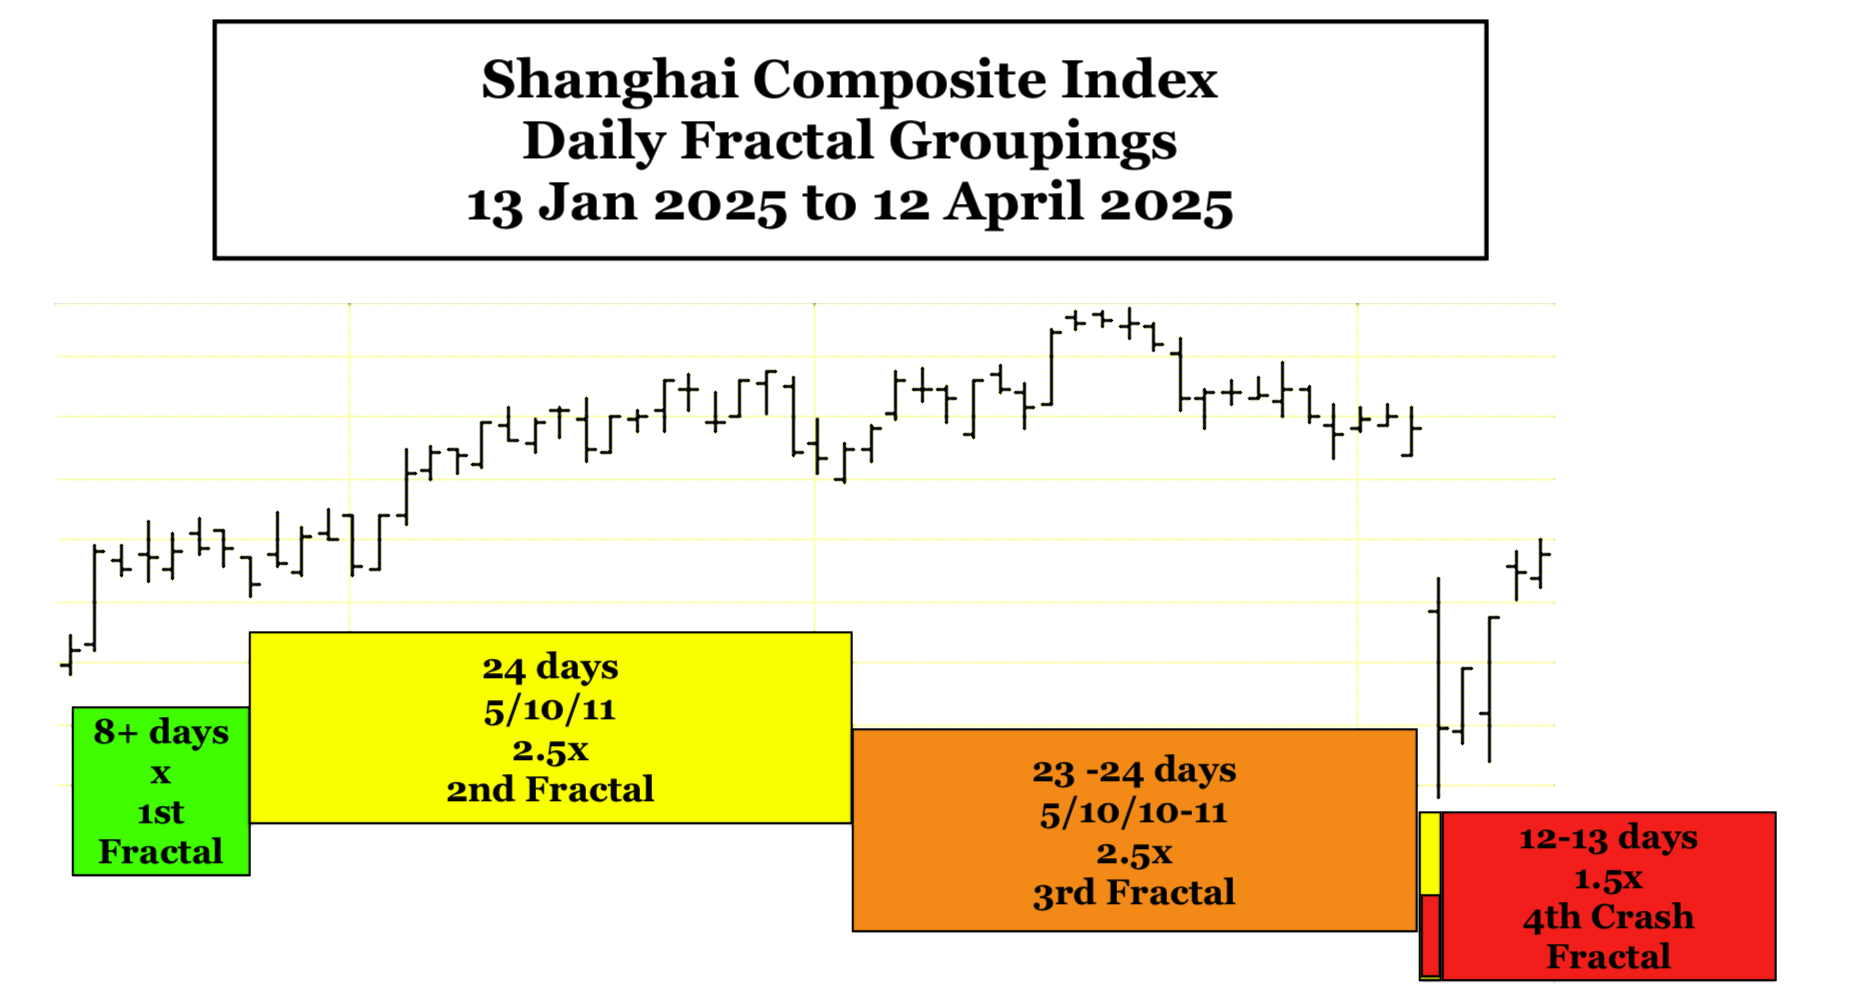
On a daily basis the SCI final 4-phase fractal series akin to the SPX 3 February 2025 8/19/20/12-13 day terminal growth and crash fractal series starts on 13 Jan 2025 and consists of a 4-phase 8+/24/23/12-13 day series. The incipient primary 1st decay fractal is the summation of the 2nd, 3rd, and 4th fractals or about 58 days. A 58/116-125/116-125/75-78 day x/2-2.5x/2-2.5x/1.5-1.6x fractal decay series would place the 2026 low in about August-September.
The West: The US, Europe, and Japan: The SPX, the STOXX, the NIKKEI (The Nikkei is following a western self ordering fractal pattern)

The SPX is undergoing a 1982 13/32 of 33 year :: x/2.5x 32 of 33 year 2nd fractal nonlinear collapse similar to the 1807 36/90 year :: x/2.5x 87 of 90 year 2nd fractal collapse peaking on 3 Sept 1929(DJIA) and nadiring on 8 July 1932(DJIA). The 1982 SPX 13/32 of 33 year 1st and 2nd fractal series ending in 2026, is an interpolated fractal series(13/33/32-33/18-20 year) within the larger US 1807 36/90/90/54-57 year hegemonic 4-phase fractal series, which ends in 2074-2077. The final 3-phase x/2.5x/2.5x fractal maximum growth pattern self-similar to the 1807 36/90/90 year pattern peaking on on 8 Nov 2021 (for the US composite Wilshire) was a SPX 27 Oct 2023 55/139/138 day :: x/2.5x/2.5x maximum 3-phase growth pattern peaking on day 136 (19 Feb 2025) with a final lower low on day 138. Note the gapped nonlinear lower lows in the terminal portion of the 139 day 2nd fractal.

A potential 3 Feb 2025 4-phase Lammert terminal growth and incipient fractal crash decay series of 8/19/20/12-13 days :: x/2-2.5x/2.5x/1.6x was identified in a 1 April 2025 posting as below.
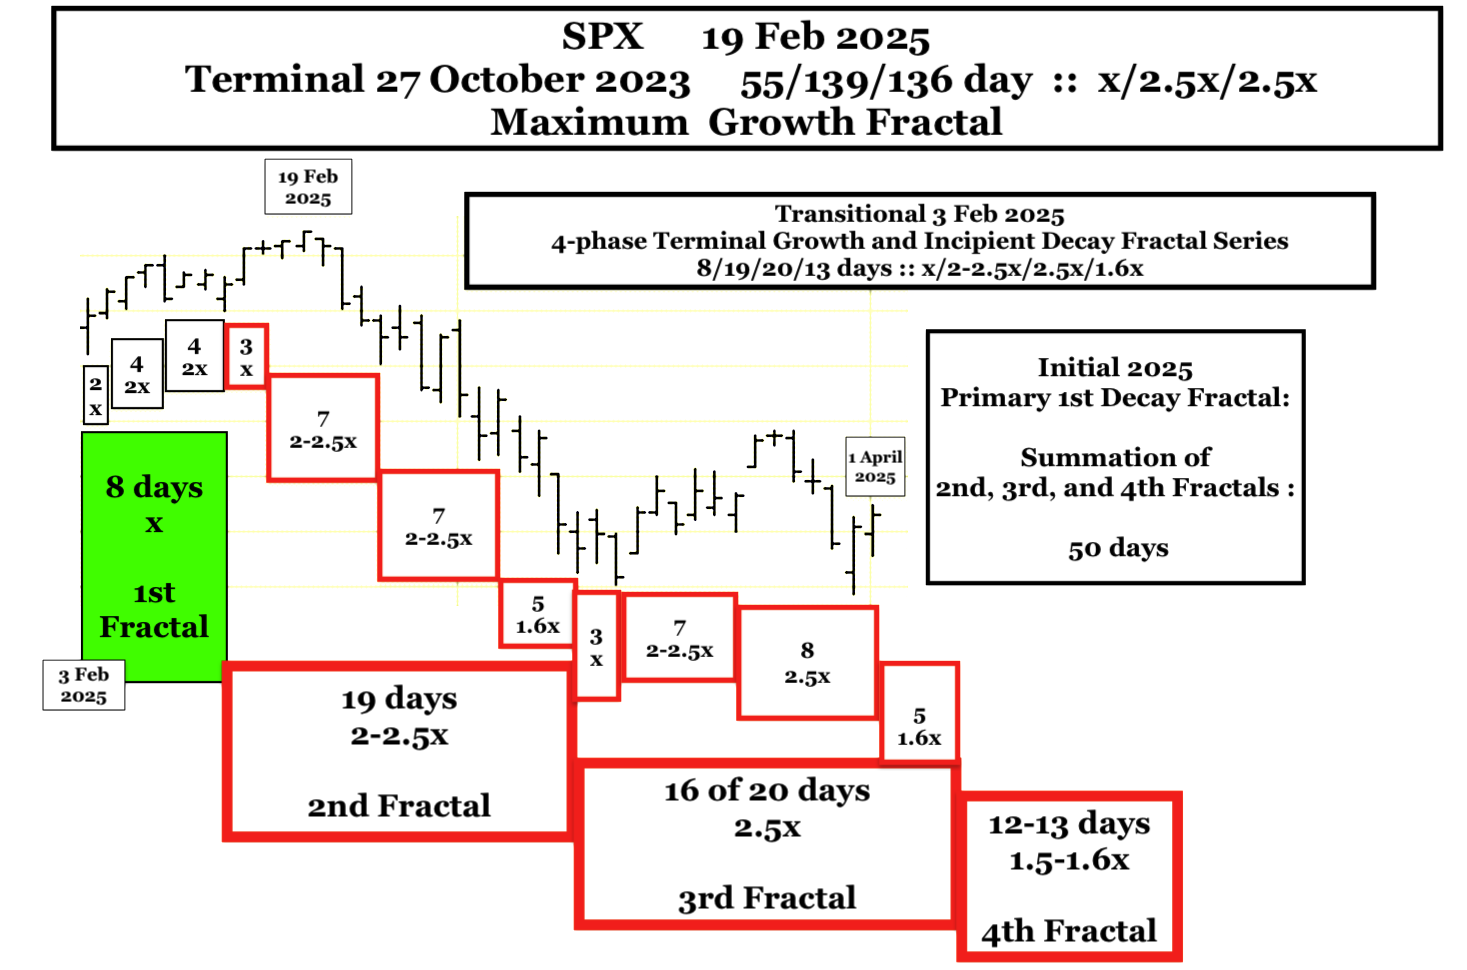
Thus far, this model is holding true with a 20 day 3rd fractal low on 7 April 2025.
The SPX is now undergoing a self-assembly process for its last 12-13 day 4th fractal in the 3 Feb 2025 terminal growth and incipient fractal crash decay series of 8/19/20/12-13 days :: x/2-2.5x/2.5x/1.5x-1.6x.
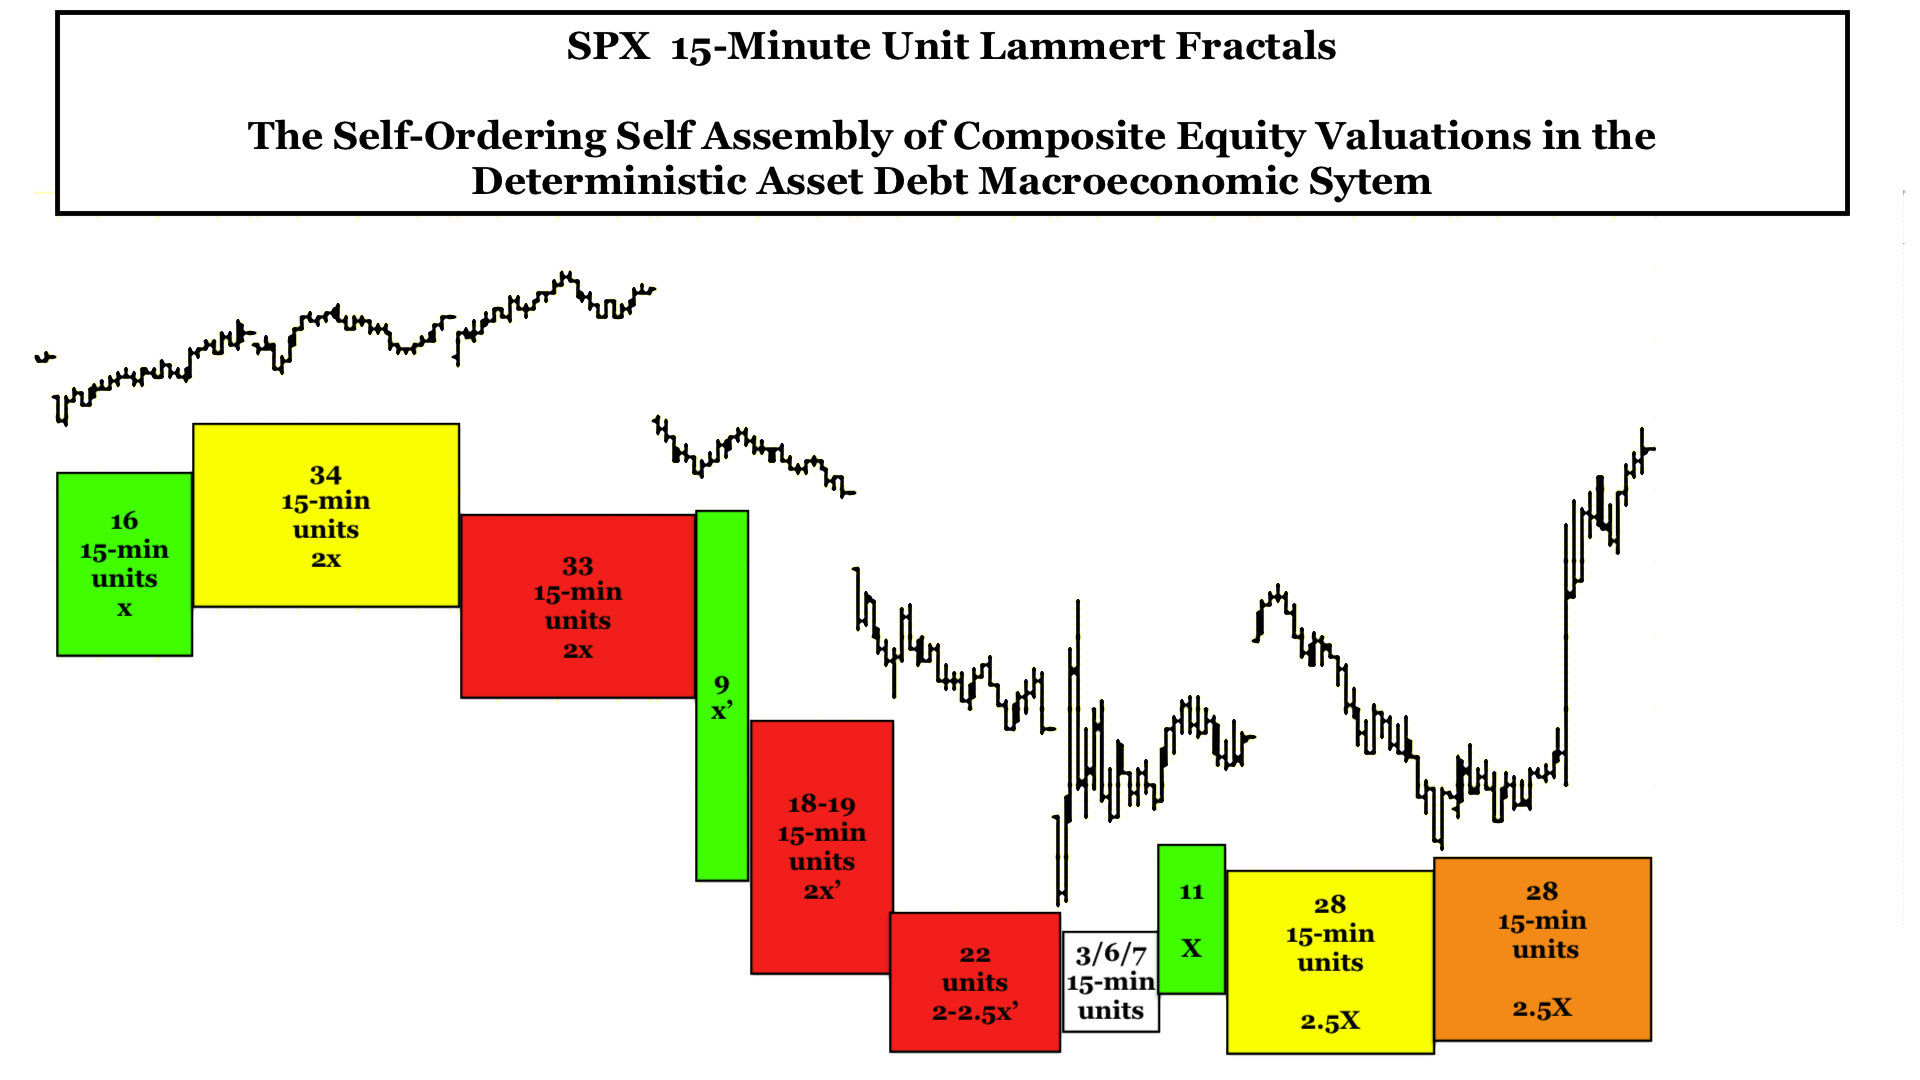
On a 15-minute fractal time basis, the 7 April 2025 3rd fractal 20 day nadir low begins its 12-13 day 4th fractal with a 3/6/7 15-minute unit :: x/2x/2-2.5x fractal growth series, followed by a 11/28/28 15-minute unit :: x/2.5x/2.5x maximal fractal growth series ending at the close on 9 April 2025 and fractally similar to the 27 Oct 2023 55/139/138 day :: x/2.5x/2.5x lower high maximum fractal growth series and the 1807 36/90/90 year :: x/2.5x/2.5x (composite Wilshire) high on 8 November 2021.
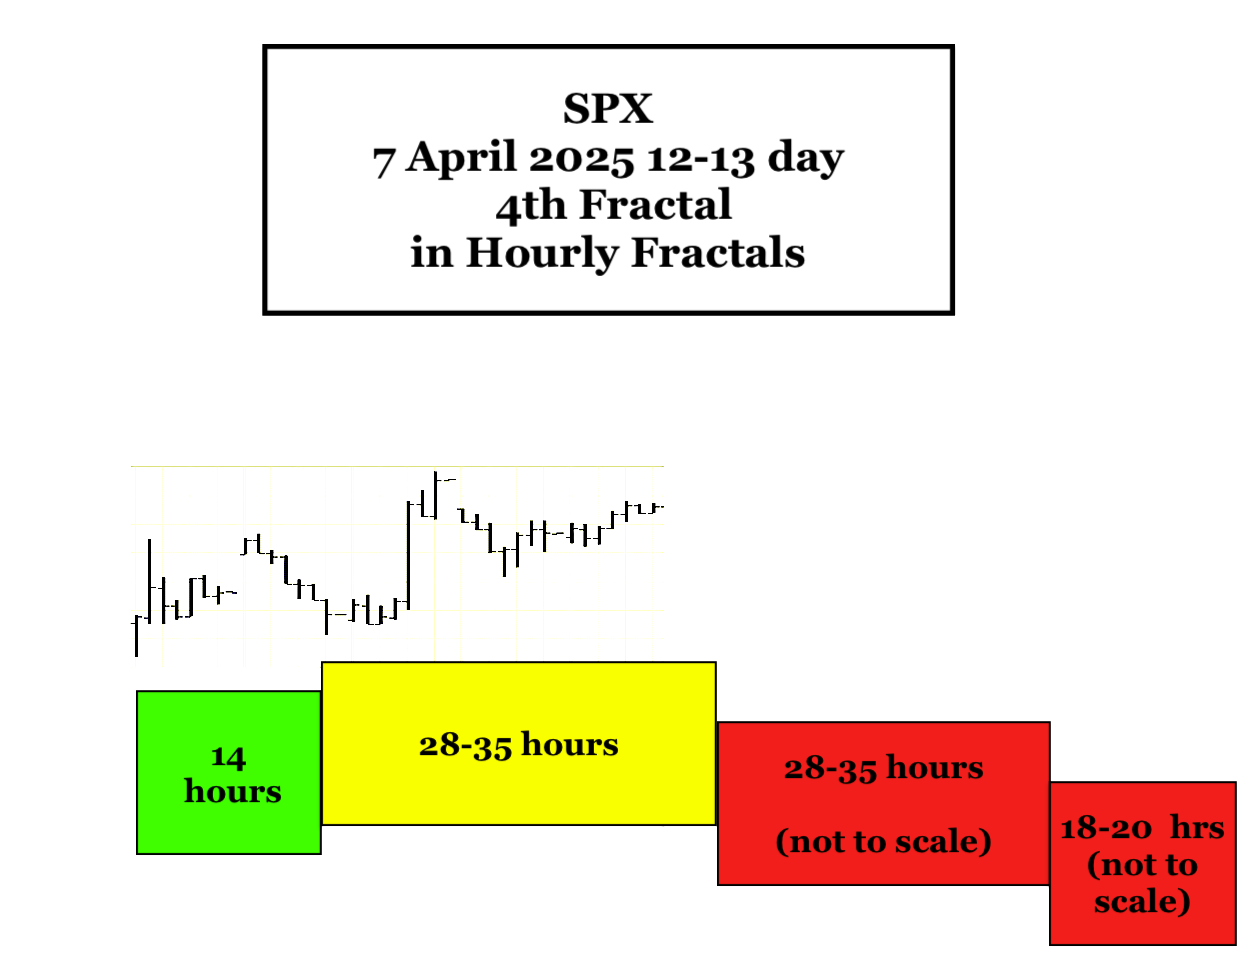
On an hourly unit fractal basis, the 12 to 13 day crash 4th fractal may be composed of a 4-phase terminal growth and crash decay fractal series: 14/22 of 28-35/28-35/18-20 hours :: x/2-2.5x/2-2.5x/1.5x.
The SPX 3 February 2025 8/19/20/12-13 day 4-phase terminal growth and incipient crash decay comes at the terminal portion of a 27 October 2023 55/139/138 lower high valuation growth fractal series with peak valuation on 19 February 2025 the 136 day of the 138 day lower high 3rd fractal. The incipient 1st decay fractal is the summation of the 2nd, 3rd, and 4th fractals or about 50 days. A 50/116-125/116-125/75-78 day 4 phase x/2-2.5x/2-2.5x/1.5-1.6x decay fractal series would placed the 2026 low in about August-September.
A Primer on Quantitative Time-based Fractal Growth and Decay of The Asset-Debt Macroeconomic System’s Composite Equities
Qualitatively …on the longest time-unit cycles (years) (e.g. 1807 36/90/90/54-57 years and 1982 13/32 of 33/32/-33/20 years) credit expands via governmental, corporate, and citizen debt; assets are produced and over-produced , overvalued and over-consumed; consumers reach maximum debt loads; the population of possible traders/invested are fully invested and composite equity asset valuations reach a singular fractal time-unit (minute, hour, day, week, month) peak valuation and thereafter undergo decay; recessions occur with weakening demand, interest rates fall; excess debt undergoes default and restructuring; individual and corporate bankruptcies occur; and composite equity (and commodity) asset valuations eventually reach a singular fractal time-unit nadir. The cycle thereafter repeats itself.
On smaller time-unit fractal cycles (quarters, months, weeks, days, hours, 15-minute/ 5 and 1-minute) : trader/investor population saturation of asset buying occurs ending in a transient peak valuation .. followed by trader/investor population saturation end selling resulting in a transient nadir valuation. These peaks and nadirs occur in one of the two quantitative fractal patterns as above.
Empirically composite equity asset valuation growth and decay cycles occur in 2 modes(laws) of mathematical self-organizing, self-assembly time-based fractal series:
a 4-phase fractal series: x/2-2.5x/2-2.5x/1.5-1.6x and
a 3-phase fractal series: x/2-2.5x/1.5-2.5x
In the 4-phase fractal series sequential elements are termed: the 1st, 2nd, 3rd, and 4th fractals and in the 3-phase fractal series: the 1st, 2nd, and 3rd fractals.
The 2nd fractal is characterized by terminal gapped nonlinear lower lows between the 2nd fractal’s terminal 2x and 2.5x time period. (These gapped nonlinear lower lows can be observed in weekly valuation units for the DJIA between 1929 and 1932, the terminal portion of the US 90 year 2nd fractal; within the last three day before the terminal 5 August 2024 139 day 2nd fractal low occurring in the 27 October 2023 55/139/136 day :: x/2.5x/2.5x valuation maximum growth series ending 19 February 2025: and can be expected within last 14-15 months on a daily and weekly basis of the current 32 of 33 year 2nd fractal of the interpolated 1982 13/32 of 33 year 1st and 2nd fractal series.
With the exception of the 3rd fractal in the 4-phase series whose fractal grouping is determined by its terminal high or final lower high peak valuation, fractals (fractal groupings) are determined by the nadirs of the first and last time unit in the grouping with all intervening valuations above the connecting nadir trend-line.
Why does the asset-debt macroeconomic system self-organize to the maximum length x/2.5x/2.5x fractal time-based growth length? It is because equities represent the system’s best available investment with the highest return with superiority over other held assets in terms of possible dividends, valuation growth, tradability, tax-advantaged capital gains, corporate advantaged debt acquisition, and corporate advantaged buy-back legislation.