THIS TIME IS DIFFERENT: MARCH 2025 IS NOT OCTOBER 1987

THIS TIME IS DIFFERENT: MARCH 2025 IS NOT OCTOBER 1987
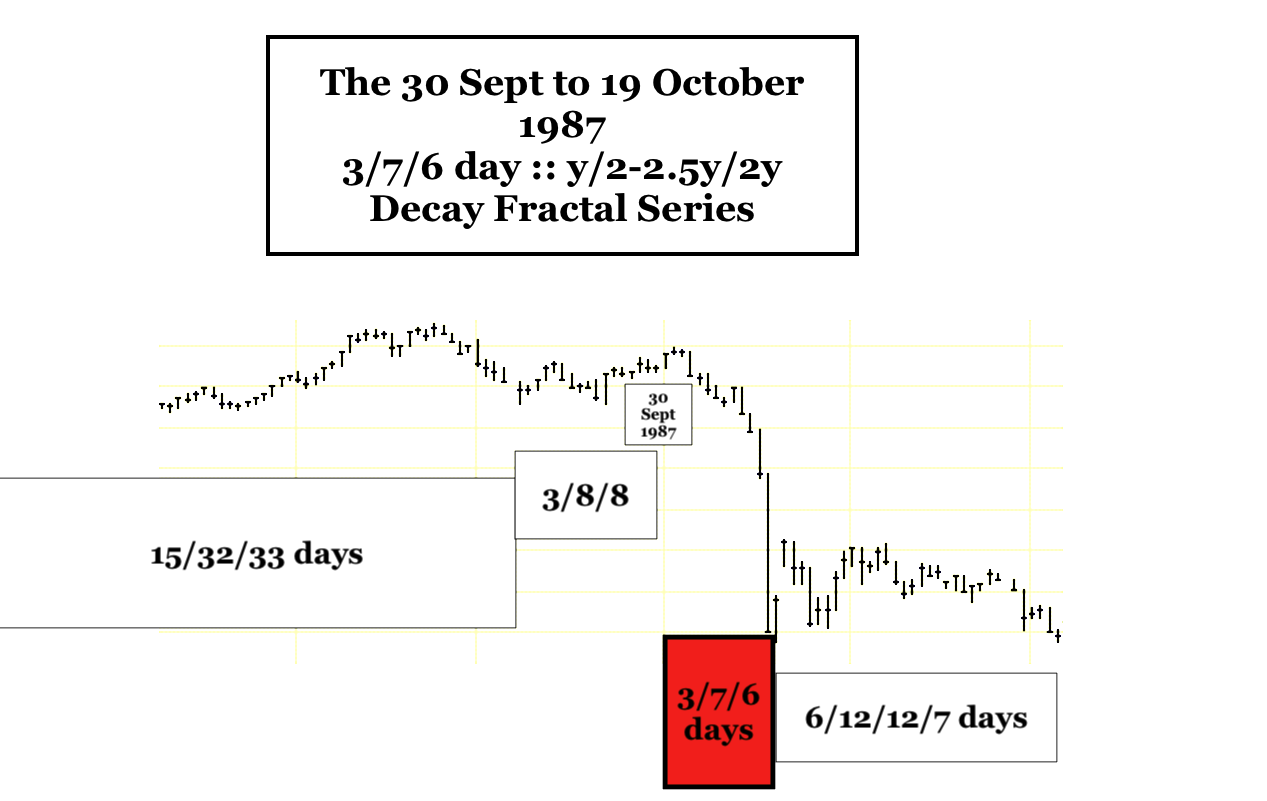
On 2 Oct 1987, the US composite SPX reached a maximum fractal length of peak secondary valuation growth and following a 30 Sept 1987 y/2-2.5y/2y :: 3/7/6 day 3 phase fractal decay series – crashed, on 19 October 1987, day 6 of the 6 day third fractal with over a 22% loss on the day and with global equities collapsing 1.7 trillion dollars on that single day of trading. Preceding peace-time historically high % Reagan GDP to deficit annual spending had built a 600 ship navy and fueled robust economic and equity growth. The 1987 debt to GDP ratio was about 39%
In 1987 the US hegemony and American manufacturing were near a zenith. Falling US interest rates from 1982 would propel an interpolated (see previous posting) first 13 year fractal from 1982 to 1994, and American innovations, US financial engineering,the US-NATO hegemony protecting the US dollar, low cost foreign labor and globalization, historically low fed fund rates, and an expanding US debt balance sheet to purchase foreign goods, provide services and defense spending would reinflate US equity growth after bubble collapses in 2000 and 2007-2008, and the after the 2020 Covid pandemic unemployment crisis resulting in the current US housing-equity-debt bubble.

In 2025 the US equity and commodity markets are near the end of a maximum length of growth of an interpolated 1982 13/32-33 year :: x/2.5x first and second fractal series. Second fractals are characterized by terminal nonlinear collapses.

In Oct 1987, five years into the 13 year equity growth first fractal, there was no 10 year note minus 3 month treasury bill debt inversion. There was no data to suggest an oncoming recession. The US hegemony and NATO alliance was strong, bankrupting the Soviet Union within the following decade. China was weak economically with only great potential by the nationalistic policies of determined sequential Chinese leaders.
In March 2025, in the 32nd year of the 32-33 year equity growth second fractal -after the longest ever, more than 750 days of 10 year note minus 3 month treasury inversion and uninversion of about 50 days – historical inversion has reoccurred in the last few trading days. Manufacturing and employment data suggest a pending recession. Federal employees who contribute to the economy maintaining mortgage and car payments are being fired en masse without cause. Smoot-Hawley-like tariffs are being enacted and the US-NATO alliance supporting the US dollar is undergoing dissolution. China has grown into the top manufacturing country, but is destabilized by a residential bubble that is on at least an order of magnitude greater than the global 2008 housing bubble.
This time is different.
In 1987 a 30 Sept 1987 3/7/6 day :: y/2.5y/2y fractal collapse ended in the 22.7% DJIA drop on 19 Oct 1987 the 6th day of the third 6 day fractal.
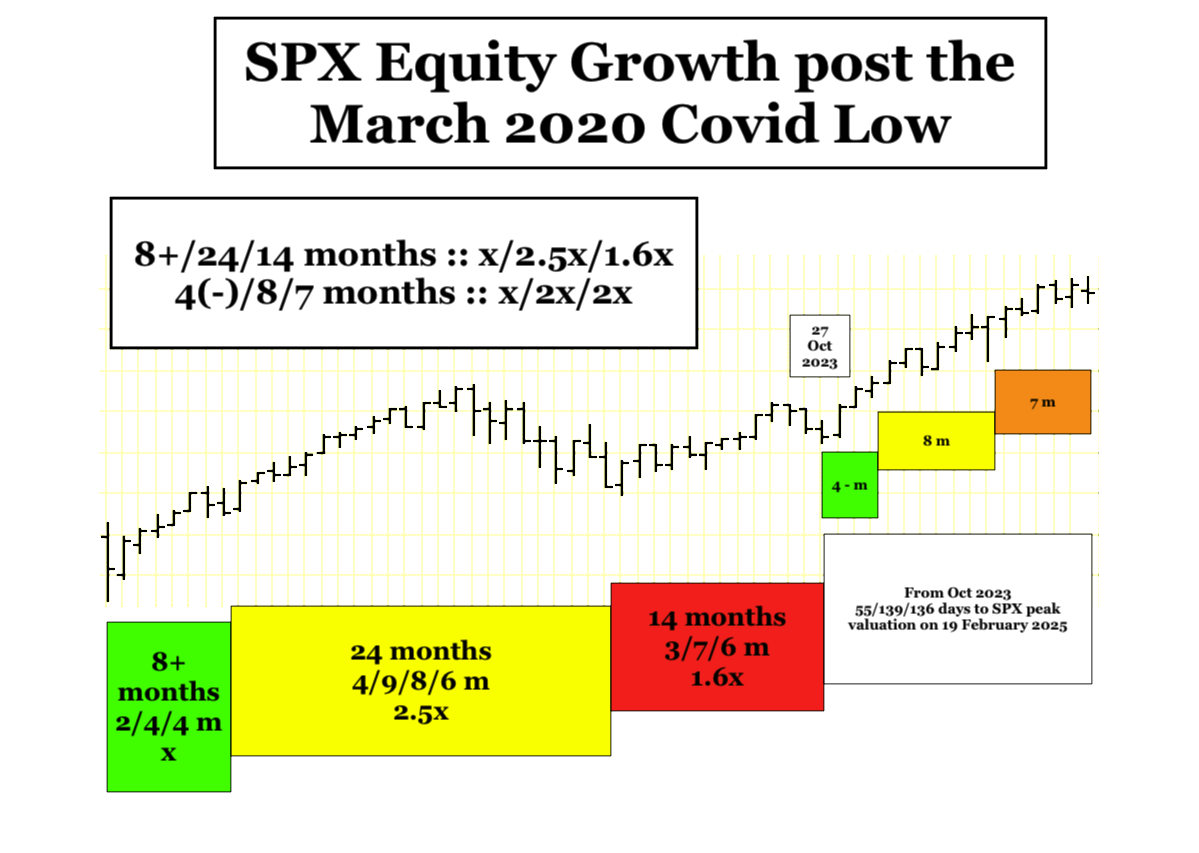
A x/2.5x/1.6x :: 8+/24/14 month SPX growth fractal series from the March 2020 Covid low ended on 27 October 2023. This growth was propelled by the excessive deficit-GDP spending by the two preceding administrations, accompanied by central bank money creation and low interest rate mortgaged back securities, and bolstered by tax cuts for the wealthiest individuals and corporations with corporate buy-backs of equities and corporate buying of residential units .

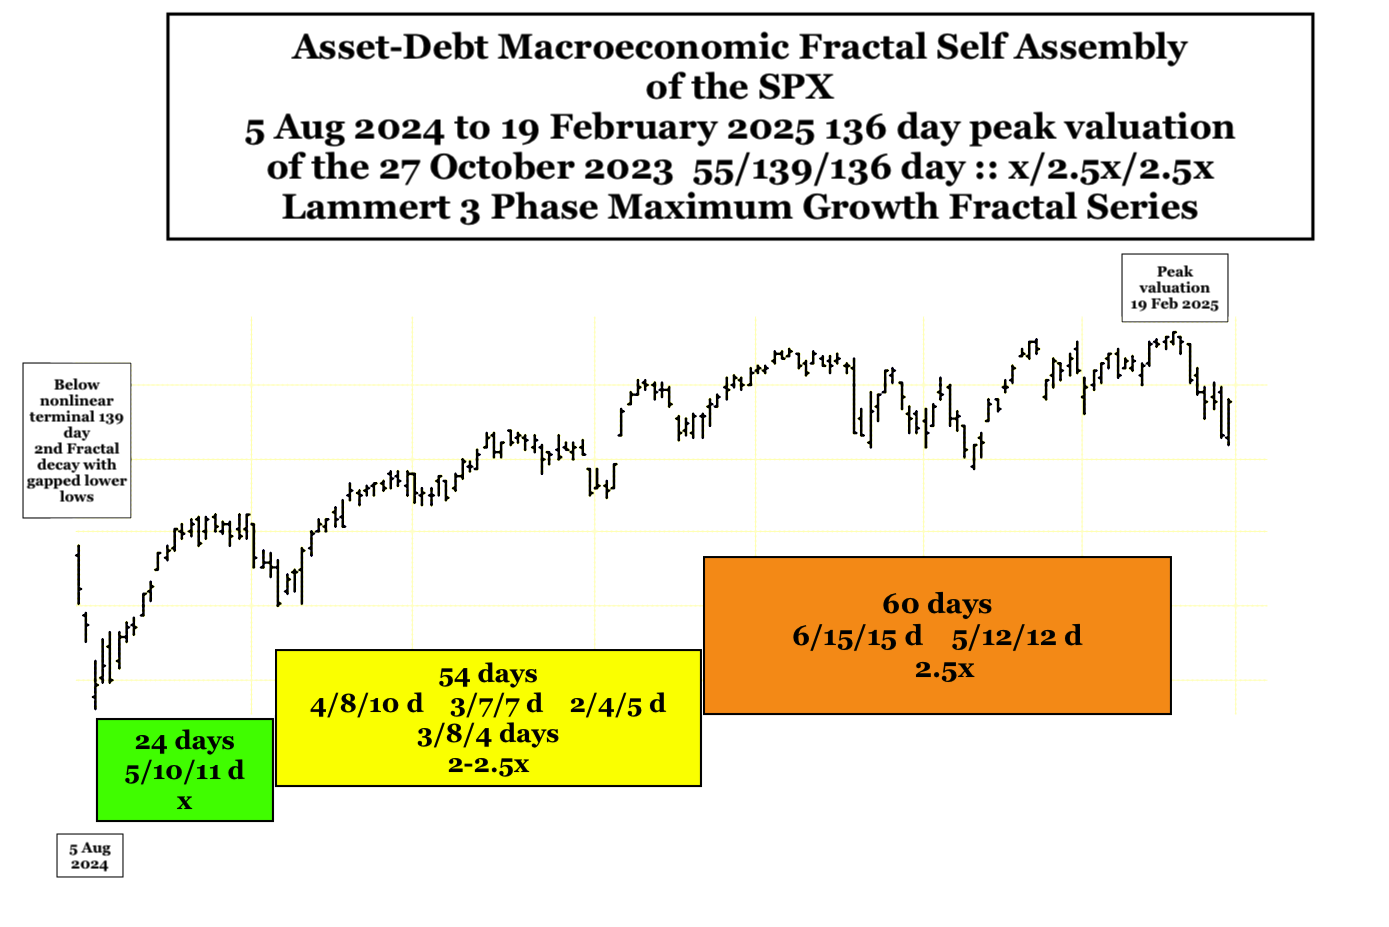
In March 2025 after a 27 November 2023 to 19 February 2025 55/139/136 day maximum SPX growth fractal series, an eerily similar 19 February 2025 3/6 of 7-8/ 6-8 day :: y/2.5y/2y-2.5y decay series similar to the Oct 1987 crash series is apparent.
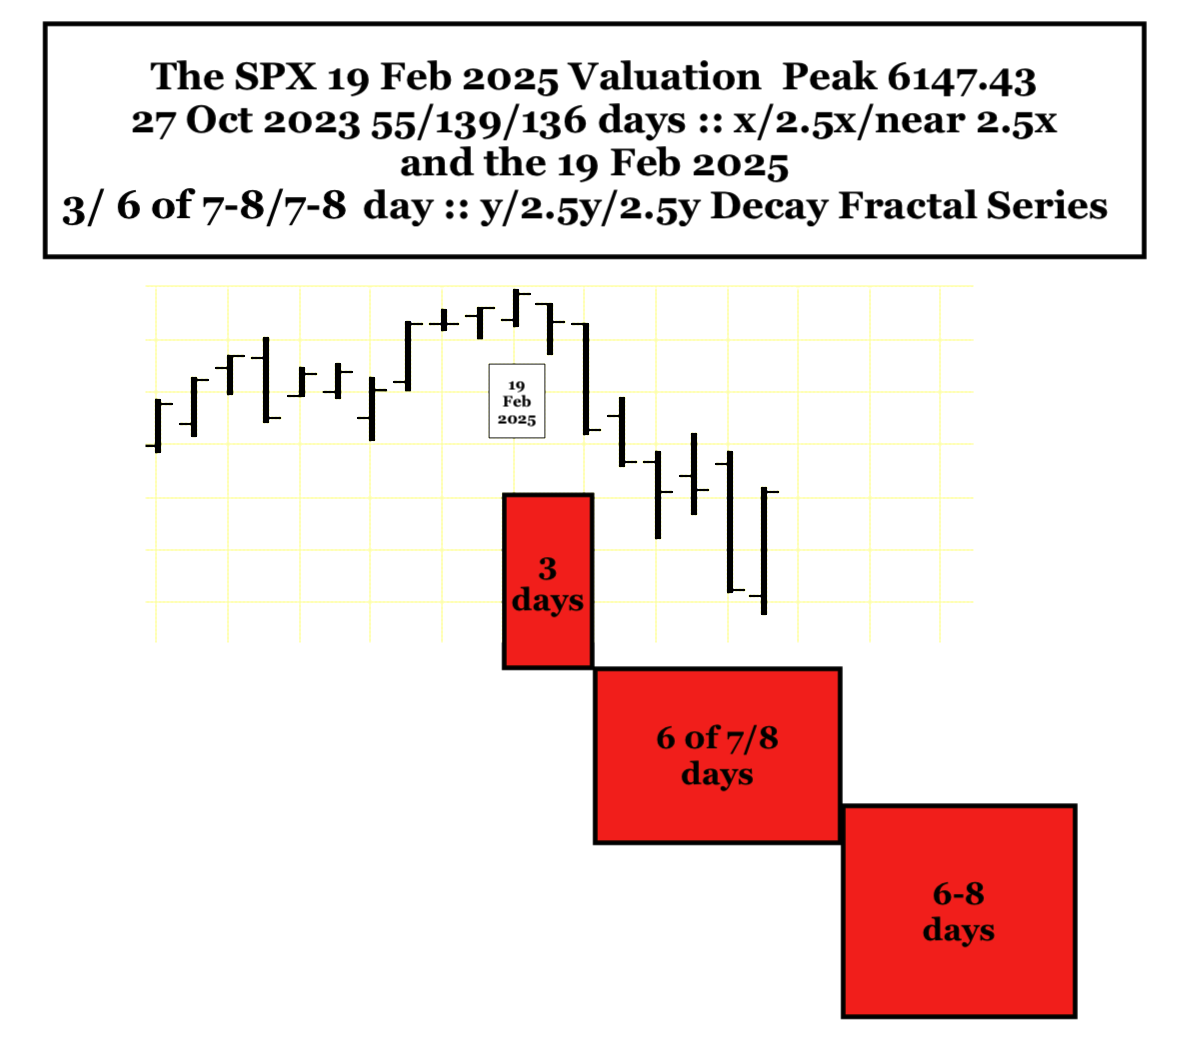
Unlike Oct 1987 which bounced off a slightly lower low 34 trading days later, March 2025 will be the first in a series of significantly lower lows.
Since the Eisenhower administration when top US individual tax rates were 90% and corporations 50%, steady tax reductions for the wealthy and corporations with unconstrained governmental spending have created greater and greater budget deficits and higher debt to GDP ratios. Unlike Chinese politicians who have promoted domestic employee wage growth and manufacturing growth nationalistic policies, both American political parties have sided with wealthy individuals and corporations to reduces taxes, expatriate US manufacturing jobs in favor of cheap labor imports and higher corporate profits, creating wider and wider wealth disparity in the United States.
Safety nets are being dismantled to afford yet greater tax cuts for wealthy individuals and corporations. 80 year old alliances with a countries having over a collective GDP of 55 trillion which support the US dollar are being undermined in favor of association with well established adversarial nations with less than a 2.5 trillion GDP.
This time is different.