The Great November 2019 Global Equity Nonlinear Crash:
As Deutsche Bank goes from its December lows: 7.5/18/15/10 of 12 weeks :: x/2.5x/2x/1.6x so goes the Global Macroeconomic Asset Debt Valuation System:
In the face of global stagnation: default on bad global debt is at its qualitative nonlinear break point.
The global system now has the dual burdens of enormous debt load and a non-expanding global economy. In the setting of a non-expanding economy to partially service and sustain the quality of that debt, recognition will be made that the debt cannot be repaid and it will under default initiating a cascade of asset devaluation and larger secondary derivative bet devaluations.
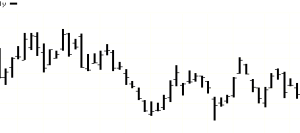
From its December 2018 lows, the Deutsche Bank weekly fractal series conveys the true state of both the European and Global Macroeconomic system. Quantitatively Deutsche Bank’s weekly fractal series and current week of that fractal series exactly matches the Global Macroeconomy’s position of sudden nonlinear collapse.
The inability and failure to further expand and inflate to sustain debt quality represents the exact conditions of a terminal illness for global asset-debt system’s peak cycle asset valuations.
Like death, asset devaluation is a sudden nonlinear event.
Was the US Federal Reserve right in lowering interest rates and encouraging citizens to preferentially place their money in a stock market deterministically destined to collapse within a fixed time fractal frame?
The Reserve can make the claim that it was attempting to do everything it could to prevent the inevitable.
For Deutsche Bank, its weekly fractal series is telltale of a nonlinear collapse occurring over the next 7 to 8 trading days. Deutsche Bank’s first and second fractals are in a classical Lammert Fractal pattern of x/2.5x :: 7.5/18 weeks.
Deutsche Bank’s third and fourth weekly fractals of the four phase series are interpolated into two subfractal series of 2/5/4/3 weeks and 3/7/6 of 8 week series with a peak valuation on week 15 of the interpolated series or week 2x of the x/2.5x/2x :: 7.5/18/15 week fractal growth series. The 4th week fractal is composed of 12 weeks starting from the 15 week high of the third fractal for a completed fractal series from the December low of 7.5/18/15/12 weeks :: x/2.5x/2x/1.5-1.6x. Nonlinearity and DB devaluation is expected in the next 8 trading days representing weeks 11 and 12 of the 4th descent fractal.
For the SPX from its December 2018 low, the final series is x/2.5x/2.5x/1.5-1.6x :: 32/79/77/42 of 50 days with the 1.5-1.6x 4th fractal in a yx’y’ pattern with x’ representing a 32 day blow-off fractal.
The SPX December 2018 low’s first and second fractals of 32/79days :: x/2.5x exactly matches Deutsch Bank’s December 2018 low’s first and second weekly fractals.
The SPX’s third fractal has a secondary peak of 2.5x or 77 days. The first y descent of its 4th fractal from the 77 day peak third fractal is part of a larger 16 day base descent fractal for an expected 40 day second fractal.
The blow off x’ fractal is now at the 32nd day with a gap higher on Friday 15 November 2018 ending near the high of the day. The x’ 32 day blow off fractal pattern (with a 16 day base descent fractal ) is composed of two subfractals: 4/9/6 days and 5/10/3 days with an expected y’ descent of 8 days for a 16/40 day :: x/2.5x fractal series.
Expect the inevitable deterministic and mathematical expected. Expect system nonlinear devaluation.

The final weekly series for the SPX from the December 2018 low is 7/18/18/9 of 11 weeks with the last 11 weeks a blow off of 2/4/5/3 weeks. The daily fractal series from the 11 week low of the blow-off is 4/9/10 and 5/12/4 of 13 days. This would put the Great Crash nonlinear low in early December 2019