The Asset-Debt System’s: 15 November 14 Day Equity Base
Decay Fractal
During private, corporate, financial industry, municipal, state, county and PIFIGS equivalent bad debt liquidation and default, US sovereign debt futures are the Global Asset-Debt system’s countervailing least worst asset.
Equity and commodity and real estate valuations are dependent on interest rate levels.
US interest rates are historically low as both market forces and central bank self purchases have yielded recent ten year rates below 1930 depression levels. This is a natural occurence in a forward based consumer and elected representative sociomacroeconomic system where the wages of future labor is traded for today’s use of goods. This system grows better with trending lower and lower interest rates with inflation of asset valuations and relative reduction of consumer debt. Because of recurrent reelection political pressure every two years in the US, the bias in this Asset Debt sociomacroeconomic system is to continuously stimulate the system thru lower and lower interest rates.
What would the value of the Wilshire be, for example, with a hypothetical 4 percent, 6 percent, or 8 percent competing US Ten Year note in a system where borrowing could only be from surplus money created through the trading of real goods and services?
The US as the current Hegemonic nation and the US dollar as the world’s reserve currency provides the US Central Bank with the unusual degrees of latitudes.
But the Asset Debt self assembly macroeconomic system does have its limits with periodical saturation involving malinvestment and bad debt accumulative load, overvaluations of assets, and overproduction of assets with regular periodic liquidation and retrenchment of all saturated elements. Smaller time based cycles are incorporated into larger cycles which are yet incorporated into larger cycles.
The US Asset Debt sociomacroeconomic system is currently at the terminal portion of a 155 year major saturation cycle incorporating smaller cycles of all of the above elements. Because of the cost of US labor relative to global prices, the US has had decitrillion dollar trading deficits with foreign countries for 20 years. Only thru lower and lower trending interest rates has the US system grown. That growth reached an asymptote in 2008.
The remarkable activity over the last 4 years by the US and European central banks to self purchase sovereign debt and underwrite large financial institutions which would have otherwise collapsed is what was necessary to occur for the current Asset Debt system to continue.
The de facto goal of this central bank activity was and is to allow an orderly process of accumulated bad debt default, asset price depreciation, and concomitant reduction in the relative surplus of assets.
By the nonlinear observed patterns of Asset debt Saturation Macroeconomics, a moderated linear bad debt default is not probable. The nonlinear collapse will be orderly in terms of quantum fractal patterns.
In the end – even with the 150 year historically low US ten year note ultimately falling below 1 % – nonlinear collapse of asset valuations are integratively dependent on the Asset-Debt’s system total bad debt accumulation, the lack of demand in the real economy, asset over supply and asset overvaluation relative to the basic unit of system, hourly wages of the employed worker, which is the start process of forward based consumption, new borrowing, and asset valuation.
Quantum Countervailing Asset Fractal Analysis: Growth Verses Decay
US Sovereign Ten Year Note Futures Verses the US SPX composite
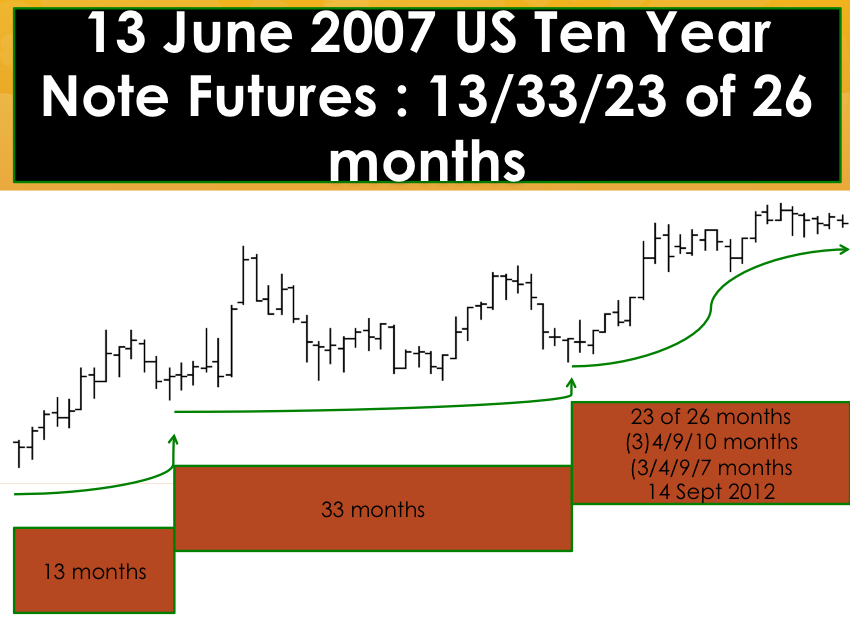
13 June 2007 US Ten Year Note Futures:
13/33/23 of 26 months :: x/2.5x/2x.
23 October 2007 US Ten Year Note Futures
23 of 26 months
(3) 4/9/7 months (14 September 2012) completed :: x/2-2.5x/1.6x.
(3)4/9/10 months (13 December 2012) completed :: x/2.5x/2.5x.

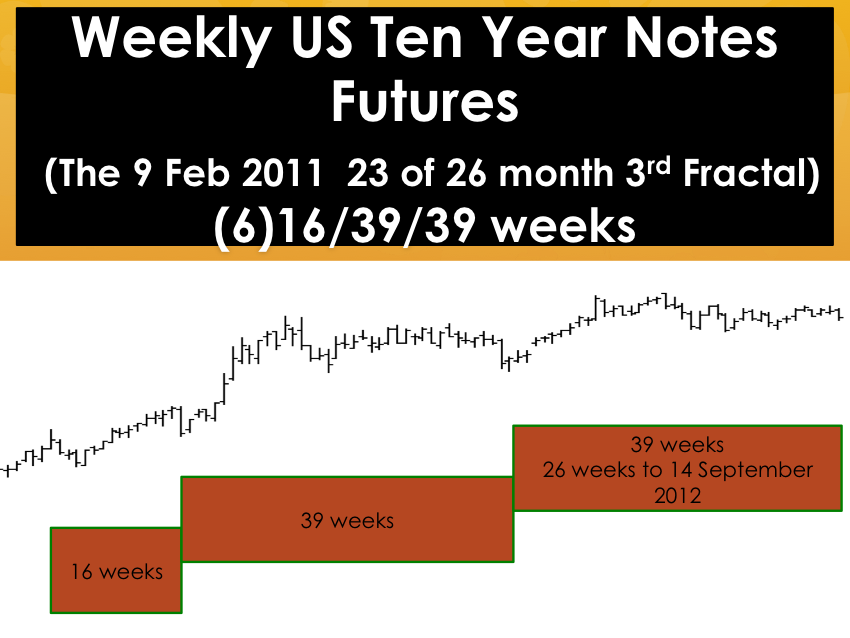
(6)16/39/39 weeks (13 December 2012) completed x/2.5x/2.5x.
The 14 Day Base Equity Decay Fractal (Use Canadian SPX for weather related US trading gaps):
23 October 2/4/4 days :: x/2x/2x to peak
Between the juncture of the 4 day 2nd fractal and the 4 day 3rd fractal, a 2/5/3 day :: y/2.5y/1.5y decay series and a conjoined 2/4/3 day :: y/2y/1.5y day decay series totaling 14 days and ending on 15 November form the initial decay base. This decay base incorporates the terminal 22nd week of the 4 October 2011 11/26/22 week growth series.
This daily y/2-2.5y/1.5y decay pattern will replicate a terminal 4 June 2012 8/17/12 week :: y/2-2.5y/1.5y conjoined terminal growth and decay fractal with the first 8/17 weeks containing the last 22 weeks of an ideal 4 October 2011 11/26/22 week Lammert growth fractal: x/2-2.5x/2x.
And this daily y/2-2.5y/1.5y pattern will replicate itself in a 29 October 2012 14/33/21 day pattern and a 3/8/5 week terminal decay fractal pattern.
Note that the Canadian composite SPX equity has taken on a reciprocal y/2.5y/1.5y decay pattern of the dominant x/2.5x/1.5x growth pattern of Hegemonic US Sovereign debt futures dating to Volcker’s 1982 America.


