Gold, Composite Equities, and The Hegemonic Long Term US Debt


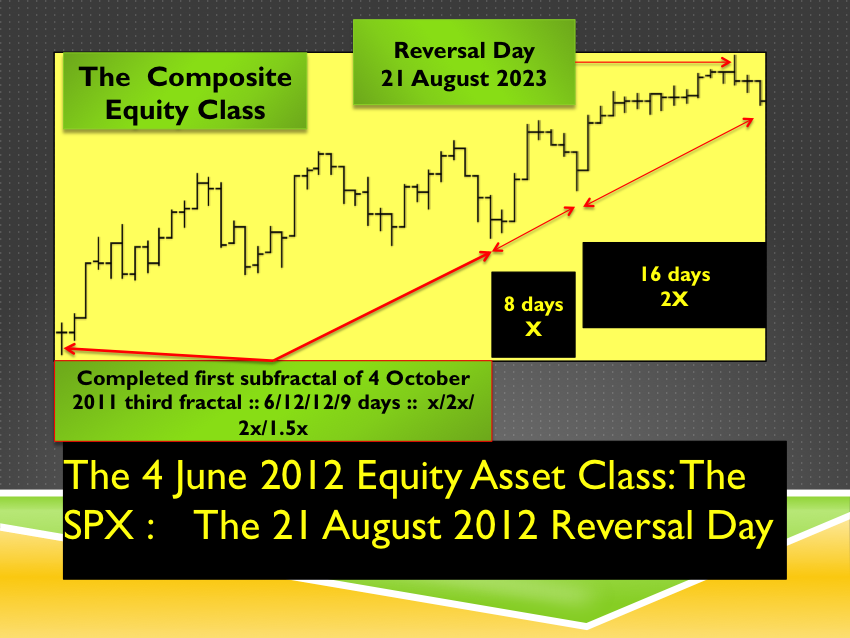
It has always been the thought that even the old grizzled fractalist would be fooled by the final equity high. By simple fractal math the composite equity final high could be a 24 July 2012 7-8/17-20/9-16 day :: x/2-5x/1.1x -2x final fractal growth pathway.
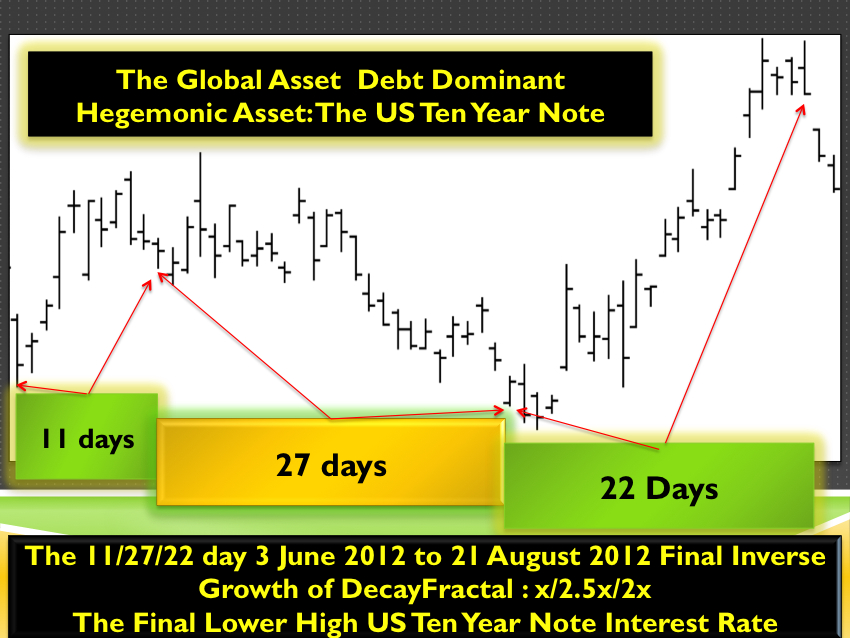
But an equity break-down on the second equity subfractal with an ascendent beginning of US long term debt as the favored much safer investment has a qualitative appeal. Us Ten Year Notes and 30 Year Bond assume the dominant investment vehicle role timed with the collapse of bad private and poorer country, city, state, county, business et. al debt denominated in other stronger sovereign currency.
Nearly all are aware of the dysequilibrium of the system and collapsing velocity of new money growth by newly created debt. QE3-nth is at hand with the intent to prevent total implosion and chaos in the debt asset system.
The long term patterned progression and behavior is the science of the mechanistic deterministic nonstochastic self organizing patterns of the quadrillion dollar equivalent debt-asset macroeconomy’s highly traded asset classes of debt, equities composites, and commodities.
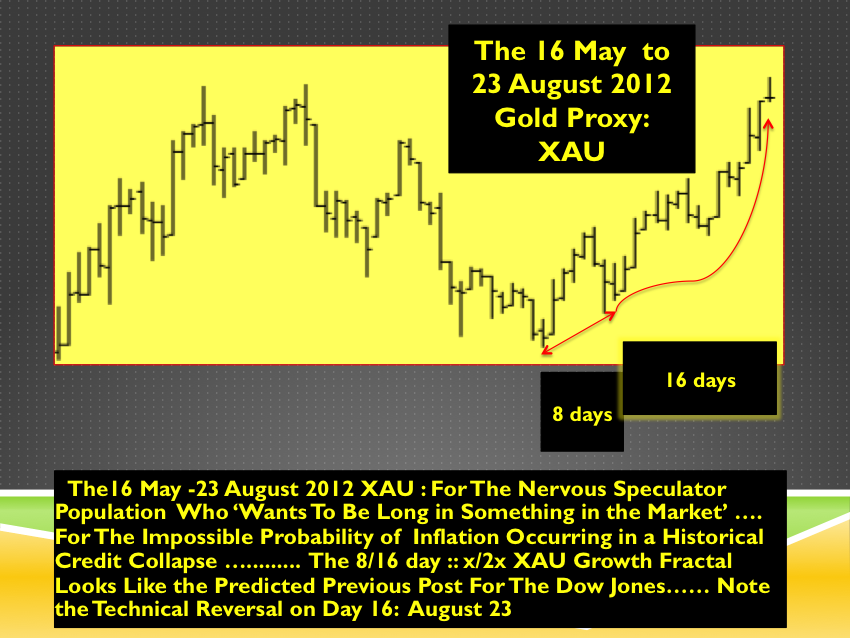
This is a qualitative guess that the system’s asset historical devaluation is imminent and that the peaks in the composite equities, commodities, and the reverse of the value of held US debt, the lower high interest rate …. occurred on 21 August, 23 August, and 21 August 2012 respectively.
Even if the short term daily fractal prognostication is wrong, the long term quantum fractal progression of the macroeconomic countervailing asset classes; sovereign hegemonic debt on the one hand and on the other commodities and equities shows a well defined self assembly pattern to macroeconomic system elevating it and its mathematical patterned behavior to a science….
“Welcome to the small alcove for the advancement of cause and effect saturation macroeconomics. This site pursues the hypothesis that the nature of market valuations and economic cycles is both causal and quantitatively decipherable. Valuations confirm (conform) to fractal cyclical patterns that can be recognized, interpreted in conjunction with data emanating from the macroeconomic system, and used with short term and long-term predicative power. Information from this site is not intended to be construed as investment advice or as an investment tool. This site has been constructed because of the expected inevitability of a major sudden phase transition to occur at the conclusion of a grand 140 plus-year second fractal cycle starting in 1858. For the masses this phase transition will occur both very unexpectedly and very suddenly. Approaching the global macro economy from such a causal and fractal Weltanschauung may help those considering further debt obligation and those in position of formulating future interest rate and monetary policy.
The cyclical nature of the macroeconomic system operates by causality rather than chance. Valuations of assets are controlled chiefly by interest rates – the cost of money. Lowering nominal interest rates, below asset inflation controlling rates, leads to macro economical disequilibria with excessive money expansion through increased borrowing. This expansion engenders unbalanced forward consumption, consumer saturation, overproduction, and inflation of assets and consumer items. With the addition of ongoing wages of the consumer masses, these oppositional elements are countervailing, and periodic macroeconomic imbalances will self correct.
Market overvaluation saturation and decay corrections to new lower saturation points occur in a fractal manner. Cyclical patterns can readily be identified on valuation charts denominated in minutely, hourly, daily, weekly, monthly, and yearly units. The transitional asymptote of overvaluation saturation curves are followed by decay curves which bring market valuations to lowered levels where intelligent buyers reenter the market.
Human psychology is a decidedly lagging indicator and follows as an end effect of the mechanistic saturation and decay evolutions in the market. Market contrarians understand these turning points and anticipate the directional changes of the markets based both on market asymptotic overvaluation saturation areas or decay end-point saturation characteristics and counter intuitively by recognizing the lagging psychological parameters of extreme optimism or pessimism in reaction to the mechanistic respective high and low points.
Both the degree of valuation and the cyclical time course of valuation evolutions appear to conform to range bound near quantum-like units and quantum related Fibonacci numbers. While the absolute degree of valuation is influenced by the absolute interest rate, the percentage or proportionality changes of valuations from highs to lows and lengths of time to decay and intra-cycle nodal points appear to conform to these range bound near quantum units.
The ideal growth fractal time sequence is X, 2.5X, 2X and 1.5-1.6X. The first two cycles include a saturation transitional point and decay process in the terminal portion of the cycles. A sudden nonlinear drop in the last 0.5x time period of the 2.5X is the hallmark of a second cycle and characterizes this most recognizable cycle. After the nonlinear gap drop, the third cycle begins. This means that the second cycle can last anywhere in length from 2x to 2.5x. The third cycle 2X is primarily a growth cycle with a lower saturation point and decay process followed by a higher saturation point. The last 1.5-1.6X cycle is primarily a decay cycle interrupted with a mid area growth period. Near ideal fractal cycles can be seen in the trading valuations of many commodities and individual stocks. Most of the cycles are caricatures of the ideal and conform to Gompertz mathematical type saturation and decay curves.
G. Lammert
This page was last updated on 15-May-2005 01:21:59 PM .”