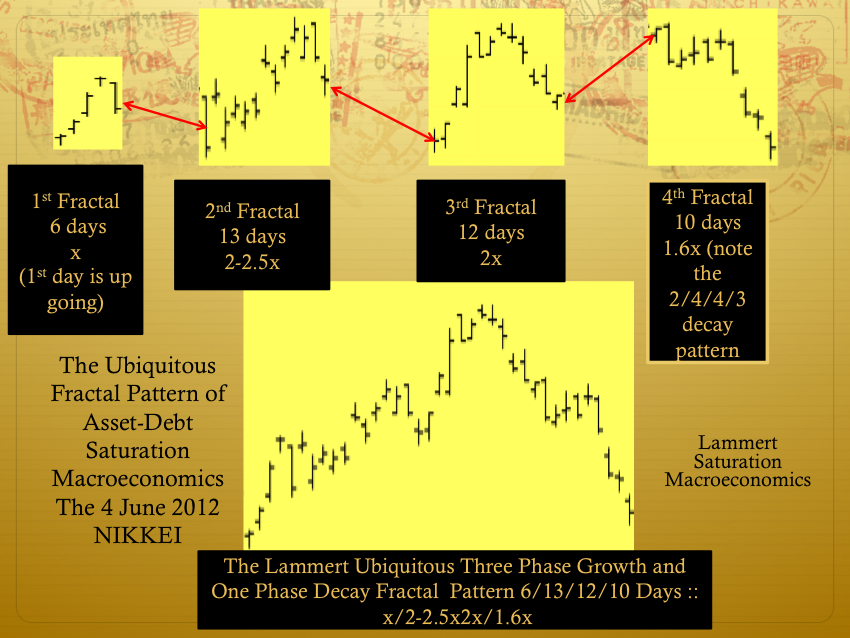
The 4 June 2012 to 25 July 2012 Nikkei : This is Non Stochastic Saturation Macroeconomics.
Lammert Saturation Economics prospectively predicted the 11 October 2007 Wilshire high valuation.
From the Mainpage of TEF: The Economic Fractalist:
The ideal growth fractal time sequence is X, 2.5X, 2X and 1.5-1.6X. The first two cycles include a saturation transitional point and decay process in the terminal portion of the cycles. A sudden nonlinear drop in the last 0.5x time period of the 2.5X is the hallmark of a second cycle and characterizes this most recognizable cycle. After the nonlinear gap drop, the third cycle begins. This means that the second cycle can last anywhere in length from 2x to 2.5x. The third cycle 2X is primarily a growth cycle with a lower saturation point and decay process followed by a higher saturation point. The last 1.5-1.6X cycle is primarily a decay cycle interrupted with a mid area growth period. Near ideal fractal cycles can be seen in the trading valuations of many commodities and individual stocks. Most of the cycles are caricatures of the ideal and conform to Gompertz mathematical type saturation and decay curves.
G. Lammert
This page was last updated on 15-May-2005 01:21:59 PM .
Saturation Macroeconomics: the debt-asset macroeconomic system as a predictable science.
What is science, but patterned behavior?
Physics, chemistry, and biology are all characterized by self assembly patterned behavior.
The patterned self organization of the subatomic particles in precise ratios to form protons and neutrons; the self assembly nature of protons, neutrons, and electrons in forming the elements of the periodic table; the further self assembly of those elemental unique atoms into molecular arrangements and the precise chemical reactions and biochemical reactions producing the more complex organic amino acids, nucleic acids, self assembly proteins forming the cell’s and neuron’s cytoskeleton microtubules and forming the long chained amino acids self conformational-folding enzymes which self regulate cellular activity; the sperm egg DNA programed self assembly process that unfolds in a mechanical deterministic way and represents the improbable science of embryology, the larger collection and self organization of matter creating solar systems, galaxies; and the sum total fields produced by the known universe self organizing collections of matter and its newly corroborated Higgs boson.
The earth’s quadrillion dollar equivalent debt asset macroeconomic system is puny compared to the universe’s smaller and larger self assembly systems – but that system and saturation macroeconomics is part of the larger deterministic system and it too has the property of self assembly.
Saturation macroeconomics, one day, will become recognized as an equivalent science.
One fifth to one quarter of the debt-asset macroeconomic system’s one quadrillion dollar equivalent valuation is debt. 99 percent (if one considers corporations and the financial industry as people) is owed by the 99 percent who trade future labor and service for immediate consumption of available assets. On the other side is the 0.05 % Trans-Generational Wealthiers, who own the debt (and the future labor and services of the 99 percent). The Trans Generational Wealthiers consider the owed debt as a positive asset entry on their total wealth valuation ledger.
Observe the 30, 50, 80, 223 years patterned valuation charts of the Wilshire (and its progenitor equity class earlier railroad and canal stocks). What particular individual news or political events caused the Wilshire’s and its progenitors’ regular periodic patterns?
The answer is none.
While the Wilshire currently valued at 14 3/4 trillion dollars represents less than 0.15 % of the quadrillion dollar equivalent global asset-debt total valuation; it represents on a daily, weekly, monthly, yearly basis: the exact summation of the total asset-debt system’s operational status at any particular point in time.
Those periodic rising and declining valuation patterns of the Wilshire were caused by credit expansion, immediate consumption, asset production and oversupply, asset overvaluation, saturation of the worthy and not so worthy debtor population, and finally bad credit liquidation.
After 223 years of patterned behavior since the signing its constitution, the hegemonic US and the world have reached an apogee of bad debt creation, asset oversupply (and overvaluation), and a generally forwardly consumed saturated status.
Can the timing of the global equity crash be accurately predicted?
It is in the US long term sovereign debt valuation saturation curves that the dominant pattern exists for determining the timing of the secondary peak valuations and, thereafter, the historical nonlinearity of valuations in the countervailing equity and commodity asset classes.
Retrospectively, does not the 30 year US bond purchased at 6–7 percent in the late 90′s looks like one of the best of all quality ‘investments.’
As the world undergoes weaker (non US) sovereign debt default, US school, city and county and perhaps state debt default, similar global local municipal debt default, industrial debt default(consider the recent articles about the debt and liquidity problems involving the saturated container shipping industry as representative of the inevitable global declining trade activity), private citizen credit card, college loan, car loan, and first and second mortgage debt default….
The massive default on non-sovereign debt is at hand and quality sovereign debt, i.e.,
US thirty year bond interest rates will plummet to less than 0.5 percent.
Can the US repay its sovereign debt?
It can and it will; It will repay every dime, nickel, and penny.
The US, as the sovereign hegemony, is the sole owner of its dollar denominated monetary system.
