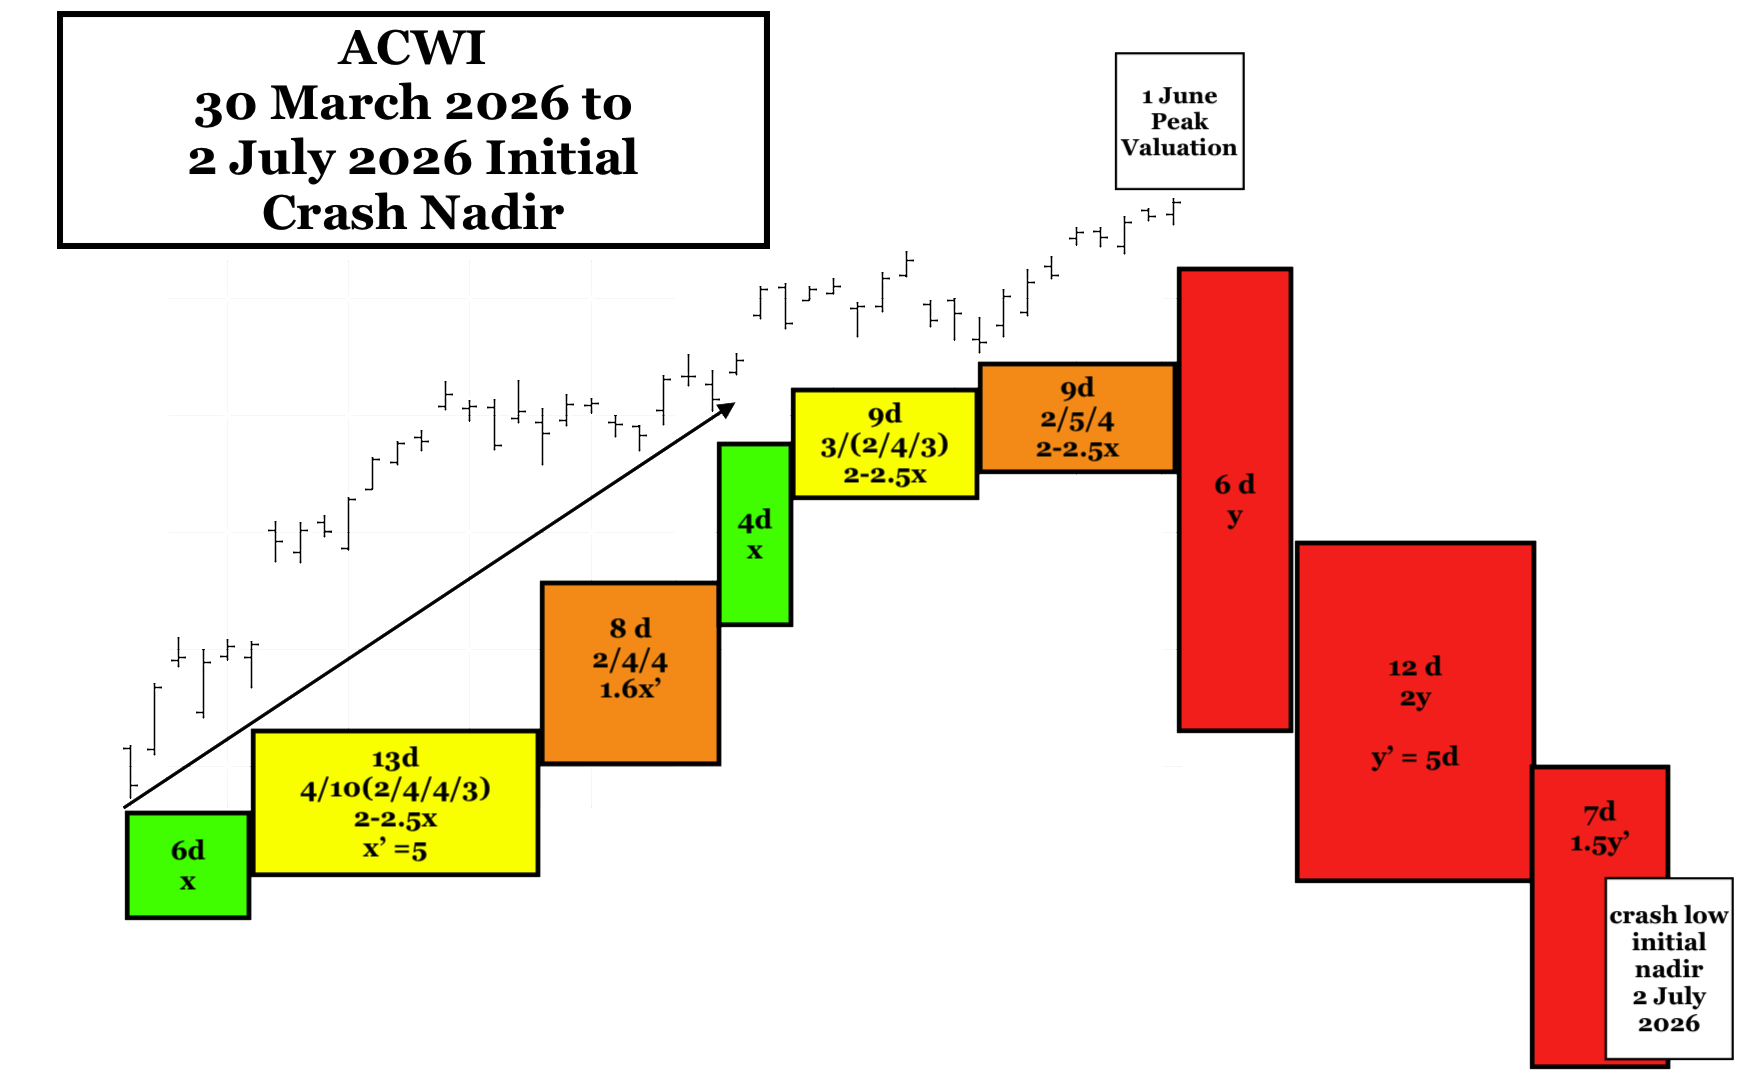
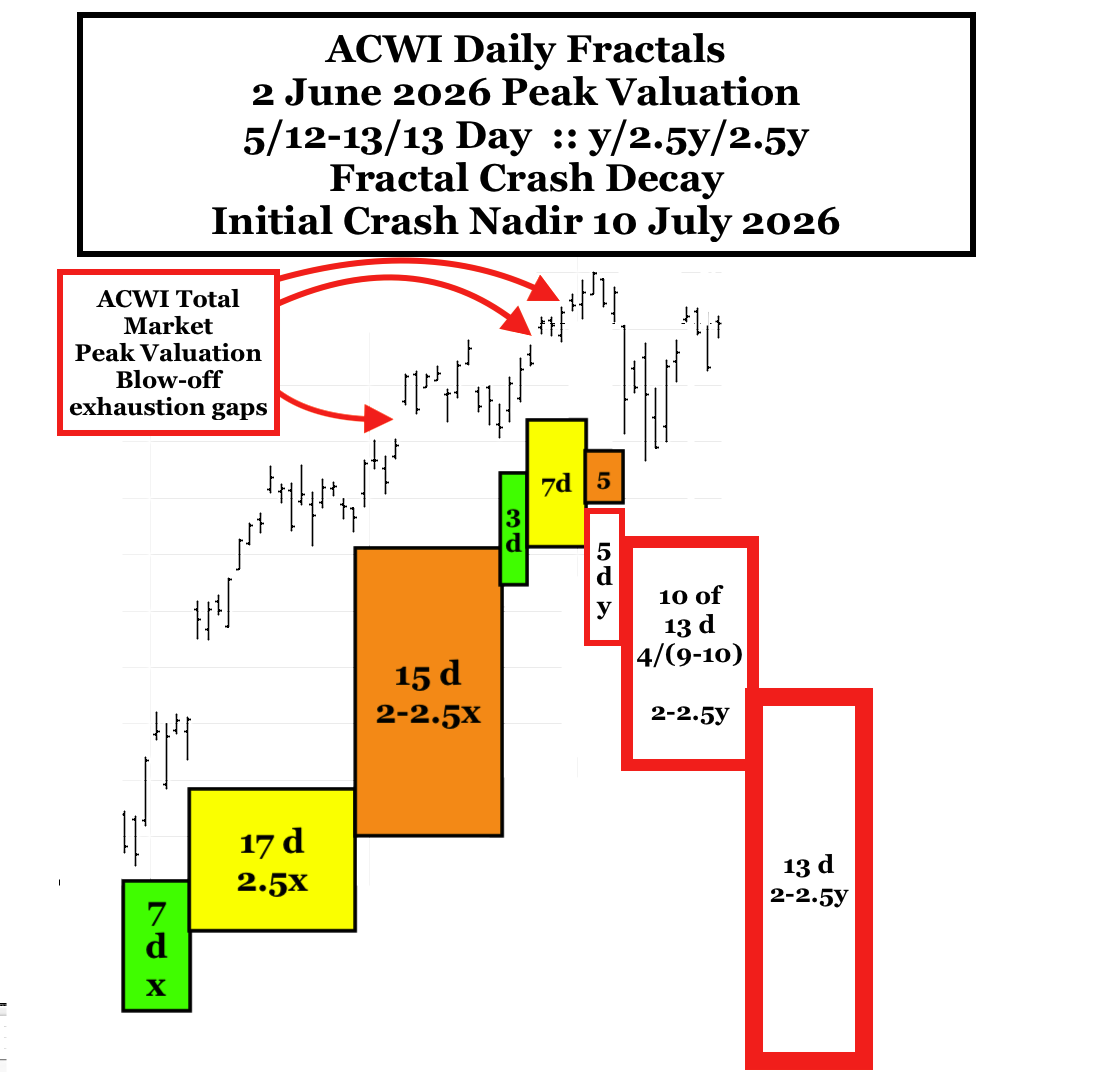
The primary fractal decay series in August 1929 was a 12/29/27 day :: 3-phase x/2-2.5x/2-2.5x fractal series with a 3 Sept 1929 peak valuation on the 6th day of the 29 day 2nd fractal.
(Below the 1929 12/29/27 day :: x/2-2.5x/2-2.5x 3-phase Lammert decay series)
It is possible that a similar x/2-2.5x/2-2.5x decay series started on 3 February 2025 with the peak SPX valuation on 19 February 2025, day 12 of the 14 day 1st Fractal. The analogous 1929 3-phase fractal decay series is 14/32/31-33 days :: x/2-2.5x/2-2.5x.
The global macroeconomy is near the end of a 1982 13/33 year :: x/2.5x asset-debt credit (fractal) cycle ending in 2026. This is analogous to the 1807 36/90 year :: x/2.5x Asset Debt 1st and 2nd fractal cycle with a DJIA peak on 3 September 1929 and final nadir on 8 July 1932. On a long term scale the 1842-43 90 year 1929 to 1932 peak to nadir DJIA 90% devaluation has the characteristics of a 2nd fractal nonlinear collapse.
The current 1982 13/33 year :: x/2.5x cycle with 32 of 33 years of its 2nd fractal completed and its ongoing 2nd fractal nonlinear collapse is interpolated within the larger US hegemonic 1807 36/90/90/54-57 year :: x/2.5x/2.5x/1.5-1.6x 4-phase fractal series ending in 2074 – 2077 with the 1932 90 year 3rd fractal peaking on 8 November 2021. (see primer below)
After the 2026 nadir, the follwing 33 years will be characterized by further US financialization of debt, new money, and new credit creation and development of new financial instruments such as 50 year loans. While the current administration’s policies will promote a departure from the dollar to other possible exchange items, America’s prior defense spending, role as a nuclear superpower, and AI and robotics capabilities, will likely carry the fraying US hegemony for another two or three decades.
The peak for the SPX of the 1982 13/33 year cycle occurred on 19 Feb 2025 with the final lower high on 21 February or day 138 of a 27 October 2023 55/139/138 day :: x/2.5x/2.5x maximum 3-phase growth series.
A Primer on Quantitative Time-based Fractal Growth and Decay of The Asset-Debt Macroeconomic System’s Composite Equities
Qualitatively …on the longest time-unit cycles (years) (e.g. 1807 36/90/90/54-57 years and 1982 13/32 of 33/32/-33/20 years) credit expands via governmental, corporate, and citizen debt; assets are produced and over-produced , overvalued and over-consumed; consumers reach maximum debt loads; the population of possible traders/invested are fully invested and composite equity asset valuations reach a singular fractal time-unit (minute, hour, day, week, month) peak valuation and thereafter undergo decay; recessions occur with weakening demand, interest rates fall; excess debt undergoes default and restructuring; individual and corporate bankruptcies occur; and composite equity (and commodity) asset valuations eventually reach a singular fractal time-unit nadir. The cycle thereafter repeats itself.
On smaller time-unit fractal cycles (quarters, months, weeks, days, hours, 15-minute/ 5 and 1-minute) : trader/investor population saturation of asset buying occurs ending in a transient peak valuation .. followed by trader/investor population saturation end selling resulting in a transient nadir valuation. These peaks and nadirs occur in one of the two quantitative fractal patterns as above.
Empirically composite equity asset valuation growth and decay cycles occur in 2 modes(laws) of mathematical self-organizing, self-assembly time-based fractal series:
a 4-phase fractal series: x/2-2.5x/2-2.5x/1.5-1.6x and
a 3-phase fractal series: x/2-2.5x/1.5-2.5x
In the 4-phase fractal series sequential elements are termed: the 1st, 2nd, 3rd, and 4th fractals and in the 3-phase fractal series: the 1st, 2nd, and 3rd fractals.
The 2nd fractal is characterized by terminal gapped nonlinear lower lows between the 2nd fractal’s terminal 2x and 2.5x time period. (These gapped nonlinear lower lows can be observed in weekly valuation units for the DJIA between 1929 and 1932, the terminal portion of the US 90 year 2nd fractal; within the last three day before the terminal 5 August 2024 139 day 2nd fractal low occurring in the 27 October 2023 55/139/136 day :: x/2.5x/2.5x valuation maximum growth series ending 19 February 2025: and can be expected within last 14-15 months on a daily and weekly basis of the current 32 of 33 year 2nd fractal of the interpolated 1982 13/32 of 33 year 1st and 2nd fractal series.
With the exception of the 3rd fractal in the 4-phase series whose fractal grouping is determined by its terminal high or final lower high peak valuation, fractals (fractal groupings) are determined by the nadirs of the first and last time unit in the grouping with all intervening valuations above the connecting nadir trend-line.