
The Self Assembly Asset Debt Macroeconomy: The deterministic asset valuation saturation curves of the composite asset-debt countervailing system:
The Wilshire Equity Class : Minutely, Hourly, Daily, Weekly, Monthly, Yearly Quantum Lammert Growth Fractals: x/2-2.5x/2-2.5x


The US and world forward consumption debt asset macrocroeconomic system’s Long Term 1789 to 2012 US Equity Class Fractal Series: The 1932 to 2012 second subfractal series of the 1858 155 year US equity second fractal series:

The Elegant and Highly Debt Leveraged Nikkei:

Above is the first subfractal of 2 subfractals starting on 4 June 2012 and composing the 3rd fractal of an ideal 25 December 2011 three phase Final Japanese Equity Composite growth series. This three phase growth and one phase decay fractal series represents exactly and encapsulates the ideal four phase mathematical fractal pattern of quantitative asset debt saturation economics.
The Nikkei: minute, hour, day, week, and month time-based quantum Lammert global asset debt fractal progression:


US Sovereign Bonds Class Assets:
At the generationally bad-debt asset-oversupplied saturated macroeconomy time era, the System’s Countervailing Sovereign Bonds become the premiere asset class. 30 year US bonds have reached lower low interest rates than in the 1930’s and countervailing higher valuations for those holding earlier purchased bonds. US Bonds and Note will reach yet lower historically low interest rates
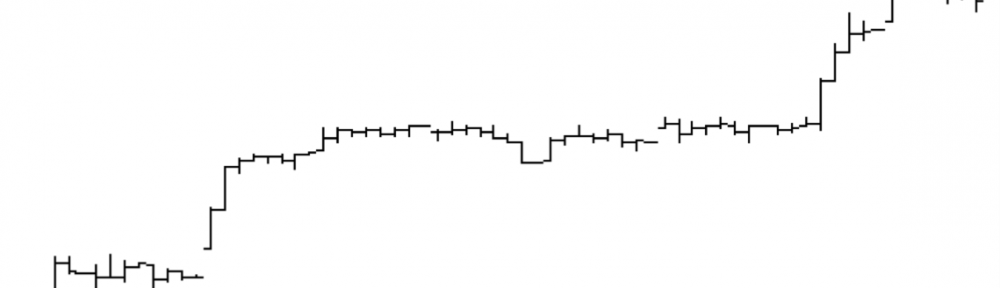
The minutely, hourly, daily quantum fractal progression of TYX, the inverse of held US bond futures: At the system’s asset debt saturation point, TYX, as the inverse of US Bond futures, evolves qualitatively in a caricatured but similar fractal directional pattern of equities and commodities.


Note TYX similar 10/25/20 hour blow-off pattern :: x/2.5x/2x as compared to the Wilshire: 11/27/27 hour ::x/2.5x/2.5x (TYX has a shorter trading day) – both reaching lower high numbers(the bonds denominated in interest rates and the Wilshire in valuation) on 14 September 2012.

The Real Blow-off Growth of the US Long Term Sovereign Note and Bond is represented below in US long term debt futures. It is the US Bond futures that represent the valuation of the held US bond asset class.
TYX represents an inverse fractal picture of US Long Term Sovereign Debt Growth. Held US Sovereign Notes and Bonds increase in value as interest rates become lower. At debt -asset macroeconomic saturation areas, where bad debt undergoes nonlinear default, equity, commodity, and real estate assets undergo devaluation in a contracting asset oversupplied economy, US sovereign debt has the valued and absolute advantaged asset class property of sovereign redemption. It is relative value of absolute redemption exponentialized in a setting of decreasing commodity, equity, and real estate valuations which is exactly the reason that US held long term debt represents the countervailing asset class to held real estate, (non-sovereign debt) commodities, and equities.
The yearly, monthly, weekly, and daily x/2-2.5x./1.5-1.6x expanding quantum fractal pattern that represents held US bond increasing valuation in a forward consumption asset-debt saturation macroeconomy:
Below is the longer term 1984 x/2.5x/1.5-1.6x blow-off patterned fractal progression of US sovereign debt.
It was on the basis of this pattern that 13 September 2012 was predicted as the US final lower high interest rate.
13 September was a x/2-2.5x/1.5x :: 4/9/6 day pattern. The actual high on 14 September was a x/2.5x/1.5x :: 4/10/6 day fractal pattern.


Below. 13 September 2012 was picked on the 26 August 2012 TEF posting as the final equity composite lower valuation high and final lower high US bond interest rates based on a x/2-2.5x/1.5x :: 4/9/6 day pattern. The actual high on 14 September and was a x/2.5x/1.5x :: 4/10/6 day fractal pattern.

How exquisitely precise is the debt-asset mathematical system: extremely.
Above is the 1,4, 5 June 2012 second fractal nonlinear transitional between the end of the 115 day Wilshire 19 December 2011 second fractal (with a first 54 day base starting on 4 October 2011) and the subsequent 74 day fractal ending on 14 September 2012.
Countervailing Asset Debt Saturation Macroeconomics is a highly patterned science.
“Welcome to the small alcove for the advancement of cause and effect saturation macroeconomics. This site pursues the hypothesis that the nature of market valuations and economic cycles is both causal and quantitatively decipherable. Valuations confirm (conform) to fractal cyclical patterns that can be recognized, interpreted in conjunction with data emanating from the macroeconomic system, and used with short term and long-term predicative power. Information from this site is not intended to be construed as investment advice or as an investment tool. This site has been constructed because of the expected inevitability of a major sudden phase transition to occur at the conclusion of a grand 140 plus-year second fractal cycle starting in 1858. For the masses this phase transition will occur both very unexpectedly and very suddenly. Approaching the global macro economy from such a causal and fractal Weltanschauung may help those considering further debt obligation and those in position of formulating future interest rate and monetary policy.
The cyclical nature of the macroeconomic system operates by causality rather than chance. Valuations of assets are controlled chiefly by interest rates – the cost of money. Lowering nominal interest rates, below asset inflation controlling rates, leads to macro economical disequilibria with excessive money expansion through increased borrowing. This expansion engenders unbalanced forward consumption, consumer saturation, overproduction, and inflation of assets and consumer items. With the addition of ongoing wages of the consumer masses, these oppositional elements are countervailing, and periodic macroeconomic imbalances will self correct.
Market overvaluation saturation and decay corrections to new lower saturation points occur in a fractal manner. Cyclical patterns can readily be identified on valuation charts denominated in minutely, hourly, daily, weekly, monthly, and yearly units. The transitional asymptote of overvaluation saturation curves are followed by decay curves which bring market valuations to lowered levels where intelligent buyers reenter the market.
Human psychology is a decidedly lagging indicator and follows as an end effect of the mechanistic saturation and decay evolutions in the market. Market contrarians understand these turning points and anticipate the directional changes of the markets based both on market asymptotic overvaluation saturation areas or decay end-point saturation characteristics and counter intuitively by recognizing the lagging psychological parameters of extreme optimism or pessimism in reaction to the mechanistic respective high and low points.
Both the degree of valuation and the cyclical time course of valuation evolutions appear to conform to range bound near quantum-like units and quantum related Fibonacci numbers. While the absolute degree of valuation is influenced by the absolute interest rate, the percentage or proportionality changes of valuations from highs to lows and lengths of time to decay and intra-cycle nodal points appear to conform to these range bound near quantum units.
The ideal growth fractal time sequence is X, 2.5X, 2X and 1.5-1.6X. The first two cycles include a saturation transitional point and decay process in the terminal portion of the cycles. A sudden nonlinear drop in the last 0.5x time period of the 2.5X is the hallmark of a second cycle and characterizes this most recognizable cycle. After the nonlinear gap drop, the third cycle begins. This means that the second cycle can last anywhere in length from 2x to 2.5x. The third cycle 2X is primarily a growth cycle with a lower saturation point and decay process followed by a higher saturation point. The last 1.5-1.6X cycle is primarily a decay cycle interrupted with a mid area growth period. Near ideal fractal cycles can be seen in the trading valuations of many commodities and individual stocks. Most of the cycles are caricatures of the ideal and conform to Gompertz mathematical type saturation and decay curves.
G. Lammert
This page was last updated on 15-May-2005 01:21:59 PM .”