China corporate debt was 29 trillion in the first quarter 2023, nearly equaling total US federal debt.
Chinese corporate debt supplied by the CCP and its banking system has powered the greatest ever GDP/dt expansion in the world’s history. But, now it is over, straining since late 2017.
China is collapsing, not unlike the US collapsed in 1929 as wages are being decreased, service sector and manufacturing unemployment is growing, Chinese real estate, the asset ownership of choice, is undergoing devaluation, and mortgages are undergoing default in a systematic domino exponential collapse. The Chinese financial industry has had wage reductions of up to 40 percent over the 3-9 months.
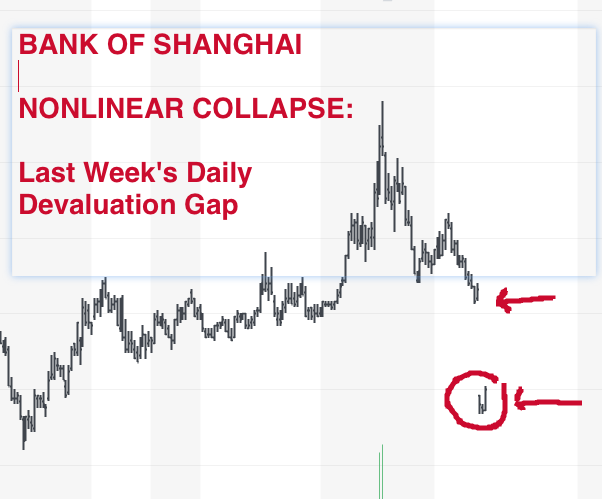
The global asset-debt system is interlocking. The collapse of the Chinese banking and real estate interlinked systems will parallel an interlocking nonlinear collapse in global asset commodity and stock prices. Last week’s nonlinear daily gapped lower valuation of the Bank of Shanghai is the early telltale death canary in the global system’s asset-debt coal mine.
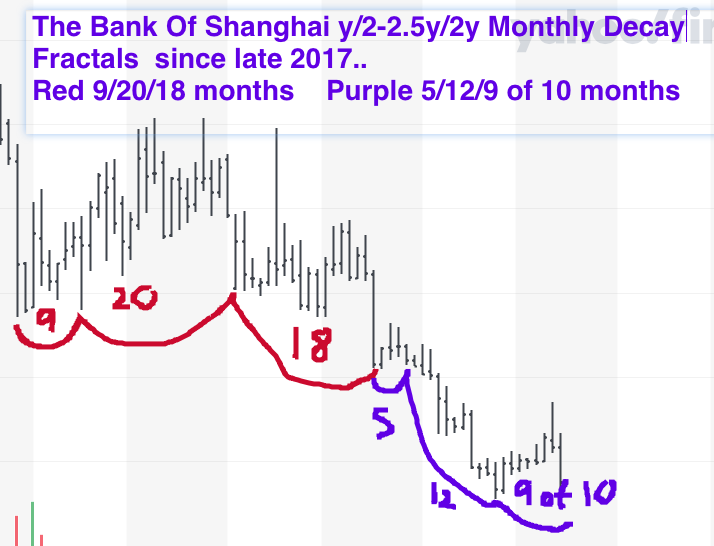
Since late 2017, the Chinese banking system and near peak real estate valuation have been undergoing quantitative fractal decline leading to a precipitous nonlinear devaluation over the next 3 weeks. The monthly fractal declines for the Bank of Shanghai are following a very classic repetitive y/2-2.5y/2y decay fractal series.
From November 2017 a 9/20/18 months decay series is followed by a like 5/12/9 of 10 month decay series ending in July 2023 with an expected lower low in about 10 months.
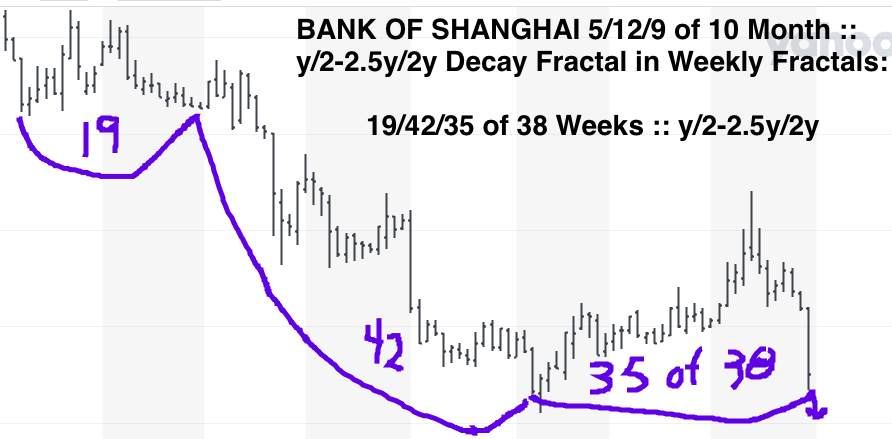
The y/2-2.5y/2y :: 5/12/9 of 10 month decay series equates to a y/2-2.5y/2y :: 19/42/35 of 38 week decay series.
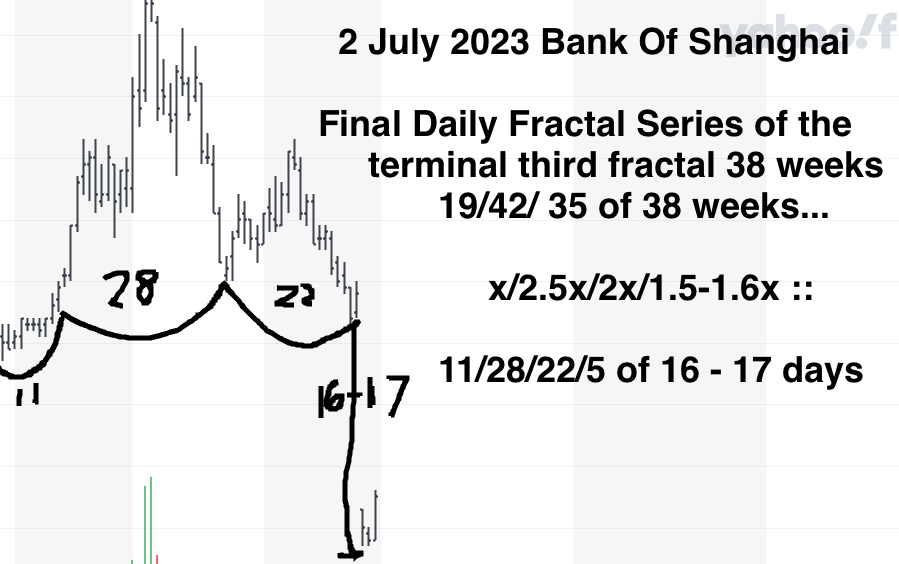
The terminal portion of the 35 of 38 week series is a 3/28/2023 11/28/22/4 of 16-18 days. (The below graph incorrectly annotates day 5 of 16-17) Already, a large nonlinear lower gap can be observed between day 1 and 2 (6/26 and 6/27/2023) of the final 17 day series. A 3/3 of 8/8 day decay series ::y/2.5y/2.5y would complete the 17 day series.
Debt has been over expanded to power asset production and valuation growth in the US, China, Europe, and India.
The global asset-debt system is currently near the time period of final valuation growth and abrupt nonlinear deleveraging. An expected 10 additional months to a lower final low is expected in-spite of the federal reserve rapidly reversing course and introducing QE with again near zero long term interest rates.
For the US Wilshire the final daily fractal series is a 17/36/26 of 37-38 day growth and decay fractal series of xy/2xy/2xy, starting on 13 March 2023.
Tesla is following a 3 January 2023 24/56/46 of 57-58 day :: y/2-2.5y/2- 2.5y decay series, Observe the 56 day second fractal’s nonlinear gapped low between day 51 and 52, in the terminal 2-2.5x region, characterizing a second fractal. A secondary lower high peak valuation is expected near day 48 of the third fractal. The x/2-2.5x/2x :: 24/56/48 day growth fractal will then efficiently transform into a y/2-25y/2-2.5y decay fractal. An interpolated fractal from 5/16/2023 of 7/15/13-14/10-11 days will complete the 24/56/57-58 day Tesla decay fractal series.